Free Access
Fig. 7
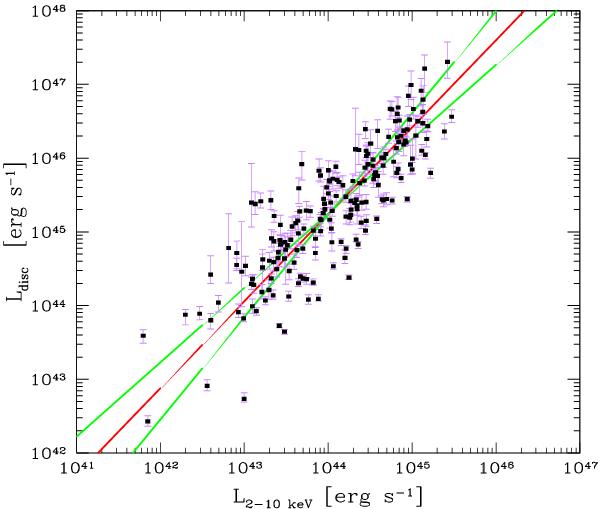
Plot of Ldisc vs. X-ray luminosity L[2−10] keV for our sample of sources. The two green lines represent the best-fit regression lines, given by Eqs. (4) and (5), obtained by interchanging the independent and dependent variable; the red line is the bisector of these two lines, parametrised by Eq. (6).
Current usage metrics show cumulative count of Article Views (full-text article views including HTML views, PDF and ePub downloads, according to the available data) and Abstracts Views on Vision4Press platform.
Data correspond to usage on the plateform after 2015. The current usage metrics is available 48-96 hours after online publication and is updated daily on week days.
Initial download of the metrics may take a while.