Free Access
Fig. 6
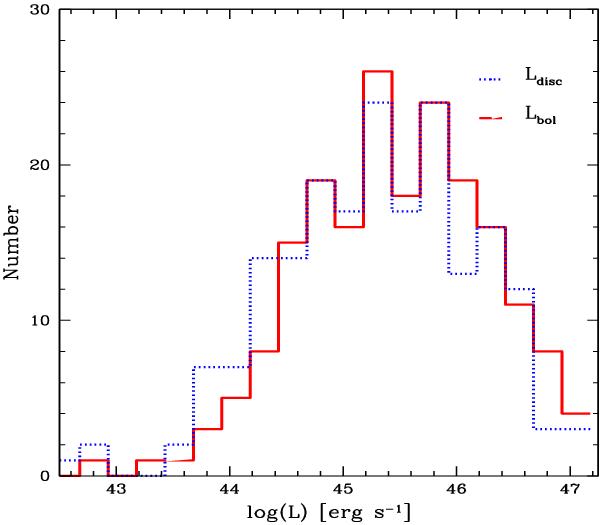
Distribution of the AGN accretion disc luminosities (dotted blue line), computed by integrating over the optical-UV continuum spectra of each source and distribution of the bolometric luminosities (solid red line), obtained as a sum of the accretion disc luminosities and the 0.1–500 keV X-ray luminosities.
Current usage metrics show cumulative count of Article Views (full-text article views including HTML views, PDF and ePub downloads, according to the available data) and Abstracts Views on Vision4Press platform.
Data correspond to usage on the plateform after 2015. The current usage metrics is available 48-96 hours after online publication and is updated daily on week days.
Initial download of the metrics may take a while.