Fig. 5
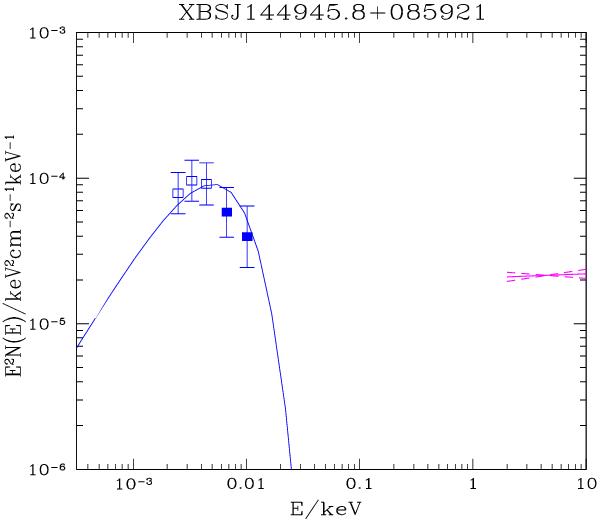
Example of the optical-UV-Xray spectral energy distribution obtained by applying the correction discussed so far. The filled blue squares are the fluxes in the GALEX NUV/FUV bands, while the empty squares represent the optical data. The fit used the model quoted in Sect. 3.4 (blue curve in the electronic form). The magenta curve is the best-fit power-law model in the X-ray energy range 2–10 keV obtained from the X-ray spectral analysis (see C11) The dashed magenta lines represent the errors on the best-fit model of the X-ray data, given by the errors on the spectral index Γ.
Current usage metrics show cumulative count of Article Views (full-text article views including HTML views, PDF and ePub downloads, according to the available data) and Abstracts Views on Vision4Press platform.
Data correspond to usage on the plateform after 2015. The current usage metrics is available 48-96 hours after online publication and is updated daily on week days.
Initial download of the metrics may take a while.