Free Access
Fig. 4
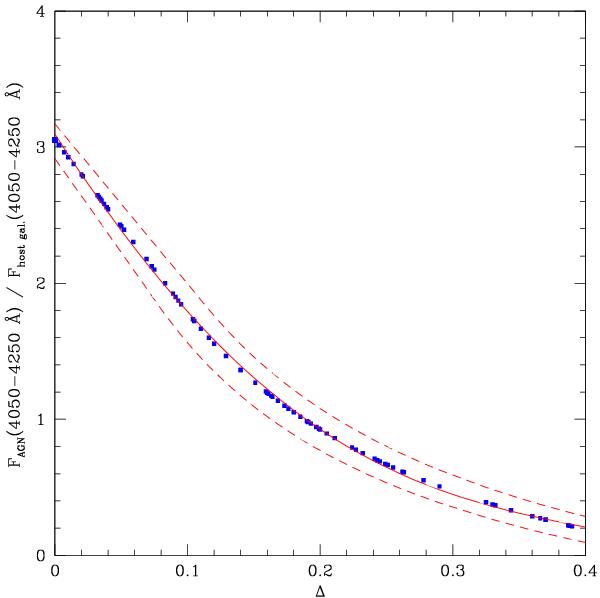
Plot of the ratio between the fluxes of AGN and host galaxy in the wavelength range 4050–4250 Å as a function of the intensity of the calcium break Δ for the sources in our sample. The relations obtained assuming a host galaxy calcium break of respectively 45% or 55% are shown as dashed lines.
Current usage metrics show cumulative count of Article Views (full-text article views including HTML views, PDF and ePub downloads, according to the available data) and Abstracts Views on Vision4Press platform.
Data correspond to usage on the plateform after 2015. The current usage metrics is available 48-96 hours after online publication and is updated daily on week days.
Initial download of the metrics may take a while.