Fig. 10
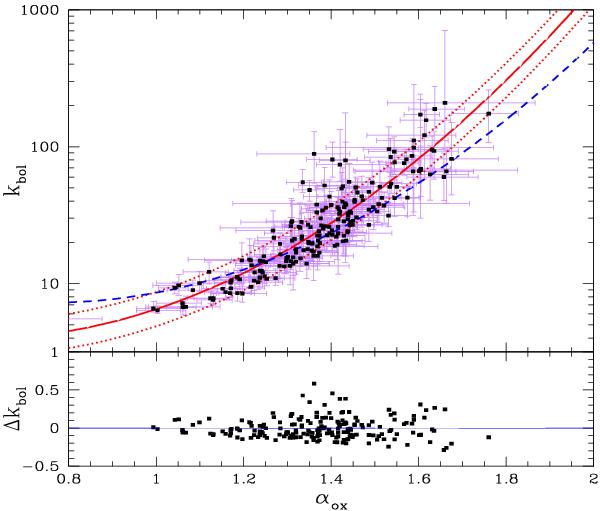
Upper panel: plot of kbol against αox for our sample of Type 1 AGN. The solid line and dotted lines represent our best fit and the range of variation with respect to the best-fit, including 68% of the sources. The dashed line represent the best fit relation computed by Lusso et al. (2010); in the bottom panel we show the residuals with respect to our best-fit relationship.
Current usage metrics show cumulative count of Article Views (full-text article views including HTML views, PDF and ePub downloads, according to the available data) and Abstracts Views on Vision4Press platform.
Data correspond to usage on the plateform after 2015. The current usage metrics is available 48-96 hours after online publication and is updated daily on week days.
Initial download of the metrics may take a while.