Fig. 12
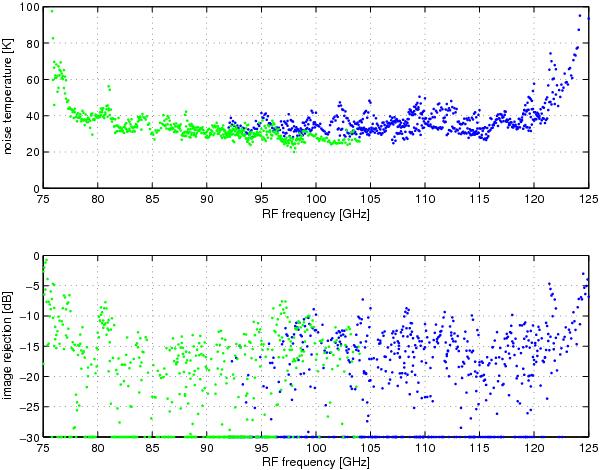
Band 1 noise temperatures (top) and image rejection (bottom) measured in the IF band for different LO frequencies. LSB measurements are plotted in green, USB results are shown in blue. Measurements performed in the laboratory, with an automated test set, before the mixer was integrated into the receiver. Note that the range of RF frequencies measured and displayed goes beyond the design range.
Current usage metrics show cumulative count of Article Views (full-text article views including HTML views, PDF and ePub downloads, according to the available data) and Abstracts Views on Vision4Press platform.
Data correspond to usage on the plateform after 2015. The current usage metrics is available 48-96 hours after online publication and is updated daily on week days.
Initial download of the metrics may take a while.