Fig. 4
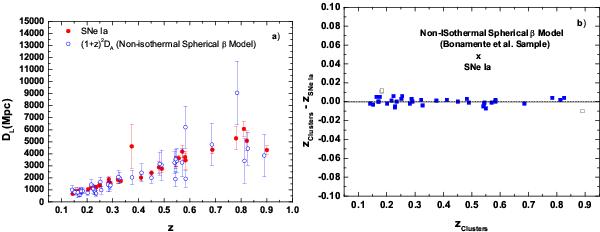
(Color online) a) Galaxy clusters and SNe Ia data. The open (blue) and filled (red) circles with the associated error bars stand for the Bonamente et al. (2006) (statistical + systematical errors) and SNe Ia (only statistical errors) samples, respectively. b) The redshift subtraction for the same pair of cluster-SNe Ia samples. As in Fig. 1b, the open squares represent the pairs of points with the biggest difference in redshifts (Δz ≈ 0.01).
Current usage metrics show cumulative count of Article Views (full-text article views including HTML views, PDF and ePub downloads, according to the available data) and Abstracts Views on Vision4Press platform.
Data correspond to usage on the plateform after 2015. The current usage metrics is available 48-96 hours after online publication and is updated daily on week days.
Initial download of the metrics may take a while.