Fig. 2
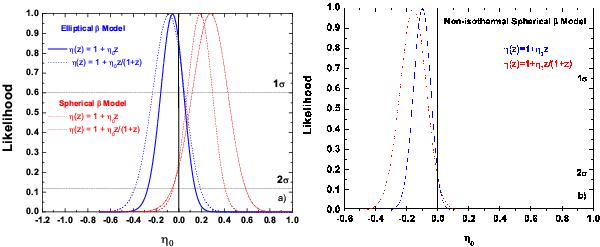
(Color online) a) Likelihood distribution functions for De Filippis et al. (2005) sample. The solid and the dotted blue lines are likelihood functions corresponding to linear and non-linear η(z) parametrizations for the isothermal elliptical β model. The dashed and the dashed-dotted red lines are likelihood functions corresponding to linear and non-linear parametrizations for the isothermal spherical β model. b) The likelihood distribution functions for Bonamente et al. (2006) sample. The solid blue line and the dotted red line correspond to linear and non-linear parametrizations.
Current usage metrics show cumulative count of Article Views (full-text article views including HTML views, PDF and ePub downloads, according to the available data) and Abstracts Views on Vision4Press platform.
Data correspond to usage on the plateform after 2015. The current usage metrics is available 48-96 hours after online publication and is updated daily on week days.
Initial download of the metrics may take a while.