Fig. 6
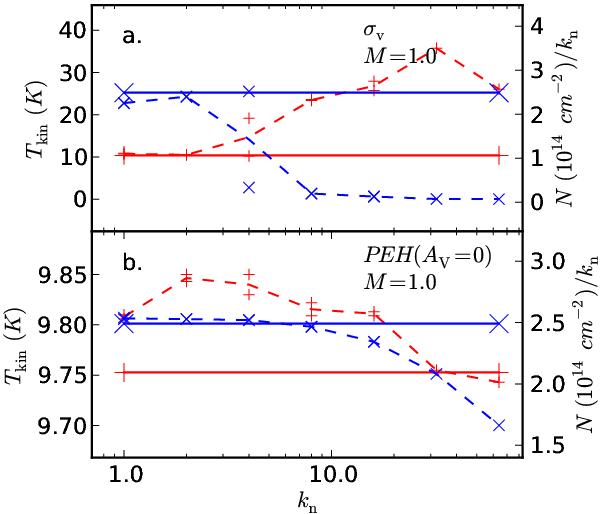
The gas kinetic temperature (plus symbols) and the column density (crosses) when the densities of the 1.0 Msun model are scaled with factors kn in the range of 1–64. The column densities have been normalized with kn. The solid lines indicate the true values and the dashed lines are the values deduced from the synthetic observations. The frames correspond to different temperature distributions as marked in the upper right hand corner of each frame.
Current usage metrics show cumulative count of Article Views (full-text article views including HTML views, PDF and ePub downloads, according to the available data) and Abstracts Views on Vision4Press platform.
Data correspond to usage on the plateform after 2015. The current usage metrics is available 48-96 hours after online publication and is updated daily on week days.
Initial download of the metrics may take a while.