Fig. 5
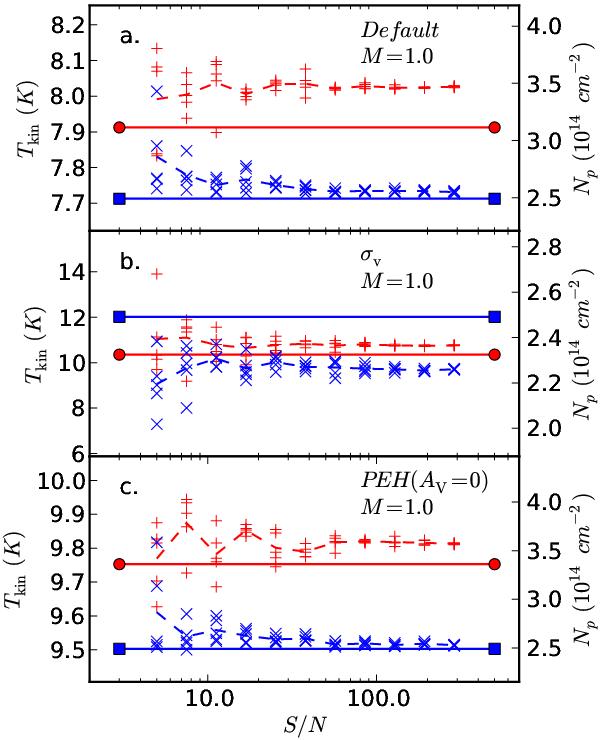
The gas kinetic temperature (plus symbols) and the column density (crosses) estimated from spectra with different signal-to-noise ratios. For each S/N ratio, the figure shows results from five realisations and their average as the dashed lines. The horizontal lines indicate the true values in the models. The three frames correspond to the default model (“def”), the σV-model, and the PEH model, respectively, of the 1.0 Msun cloud.
Current usage metrics show cumulative count of Article Views (full-text article views including HTML views, PDF and ePub downloads, according to the available data) and Abstracts Views on Vision4Press platform.
Data correspond to usage on the plateform after 2015. The current usage metrics is available 48-96 hours after online publication and is updated daily on week days.
Initial download of the metrics may take a while.