Fig. 2
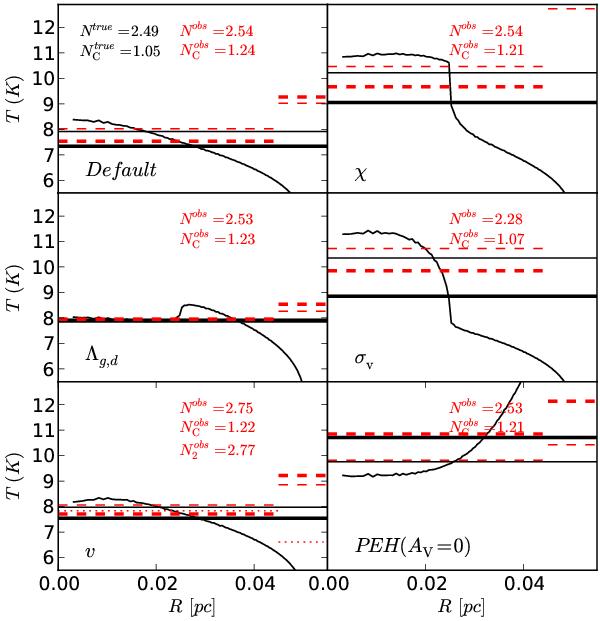
The radial temperature profiles (solid black curves), the estimated temperatures (dashed red lines), and the mass averaged true temperatures (black horizontal lines) for the one solar mass models. The thin lines correspond to the data on a single line-of-sight through the cloud centre and the thick lines to data averaged with a Gaussian beam. In the right hand part of each frame, the difference between the estimated and the real mass averaged Tkin has been scaled by a factor of ten for better visibility. The column densities derived from the observations are indicated in each frame (units of 1014 cm-2), the subscript C denoting the case with beam convolution. The true column densities are given in the first frame. For the v-model, the dotted line and the lower text entry indicate the result from a fit with two velocity components (pencil beam only).
Current usage metrics show cumulative count of Article Views (full-text article views including HTML views, PDF and ePub downloads, according to the available data) and Abstracts Views on Vision4Press platform.
Data correspond to usage on the plateform after 2015. The current usage metrics is available 48-96 hours after online publication and is updated daily on week days.
Initial download of the metrics may take a while.