Fig. 1
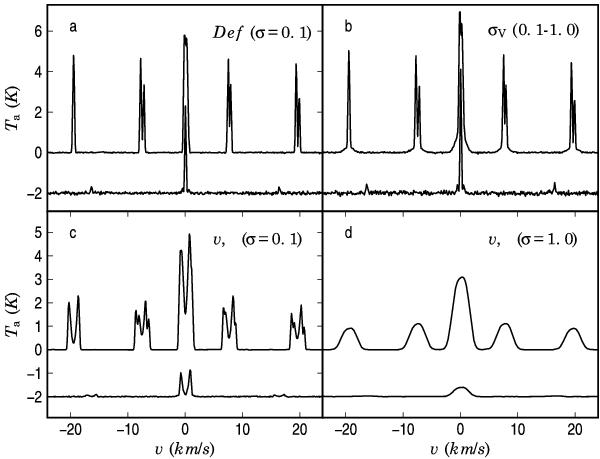
Examples of simulated ammonia spectra. Each frame shows the (1, 1) (the upper line) and the (2, 2) spectral profiles. For the plotting, the latter have been scaled by a factor of 3 and shifted by −2 K. The text in the upper right hand corner indicates the model in question and, in parentheses, the turbulent line width used in the calculation of the NH3 spectra.
Current usage metrics show cumulative count of Article Views (full-text article views including HTML views, PDF and ePub downloads, according to the available data) and Abstracts Views on Vision4Press platform.
Data correspond to usage on the plateform after 2015. The current usage metrics is available 48-96 hours after online publication and is updated daily on week days.
Initial download of the metrics may take a while.