Free Access
Fig. A.4
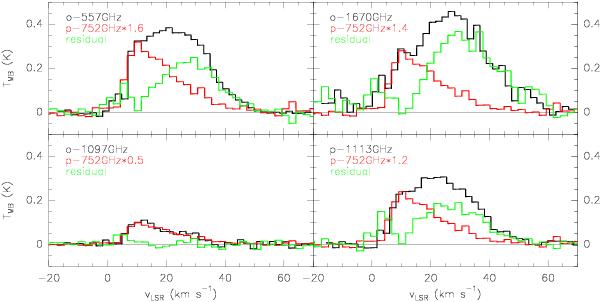
H2O line profile (black) decomposition in a triangular low-velocity component (red), derived by fitting the 752 GHz water line to the low-velocity emission profile, and a high-velocity component (green), obtained by subtracting the low-velocity component from the total water line profile.
Current usage metrics show cumulative count of Article Views (full-text article views including HTML views, PDF and ePub downloads, according to the available data) and Abstracts Views on Vision4Press platform.
Data correspond to usage on the plateform after 2015. The current usage metrics is available 48-96 hours after online publication and is updated daily on week days.
Initial download of the metrics may take a while.