Fig. 4
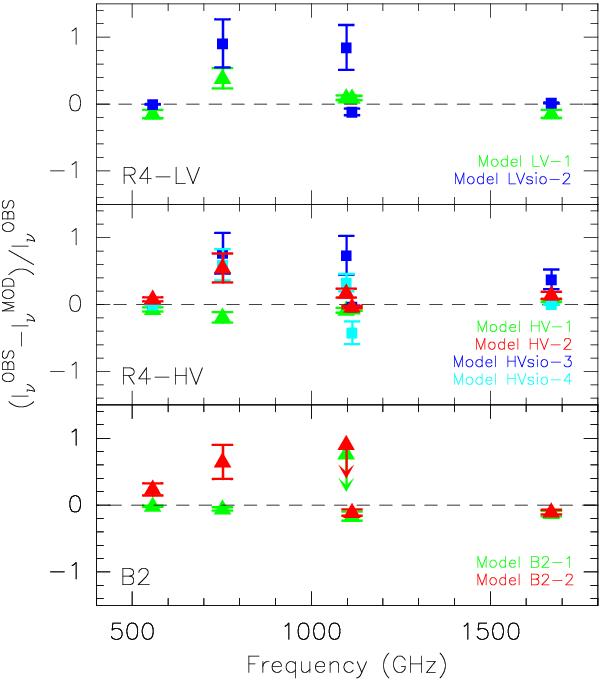
Top and middle panels: comparison between the observed water intensities and the different models in Table 2, for R4-LV (top), R4-HV (middle) and B2 (bottom). The intensities predicted by the models have been corrected for the relative predicted filling factors. The given errors include 20% of calibration error. The triangles represent the models derived from H2O and the squares from the SiO. Bottom panel: same comparison as the top panels, but for B2. The upper limit of the non-detected H2O line at 1097 GHz is also shown for each model.
Current usage metrics show cumulative count of Article Views (full-text article views including HTML views, PDF and ePub downloads, according to the available data) and Abstracts Views on Vision4Press platform.
Data correspond to usage on the plateform after 2015. The current usage metrics is available 48-96 hours after online publication and is updated daily on week days.
Initial download of the metrics may take a while.