Fig. 1
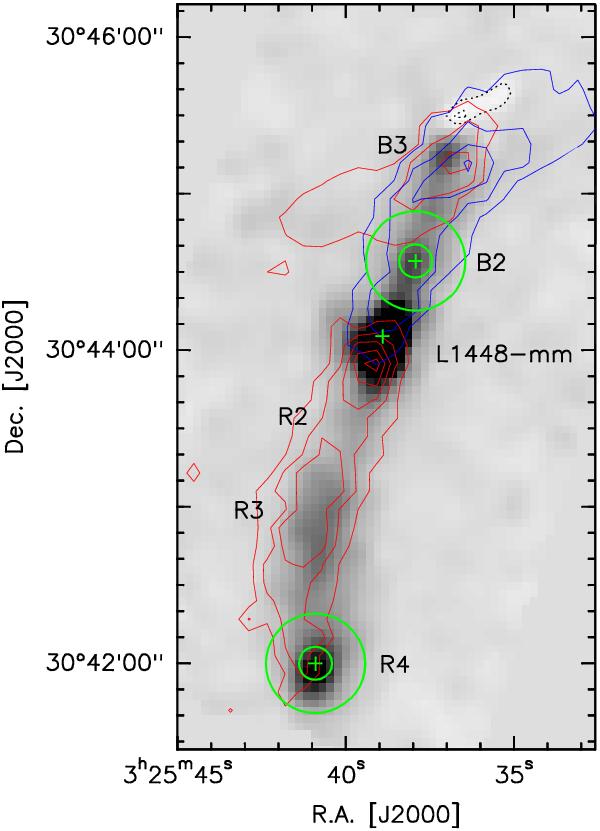
PACS image of L1448 at 1670 GHz in false colors, with the negative contours in dotted line, and the JCMT CO(3−2) emission (Nisini et al., in prep.) in contours: the blue-shifted emission is integrated between –100 and 4 km s-1 and the red-shifted emission between 6 and 100 km s-1. The central position of the map and the positions chosen for the HIFI line survey (R4 and B2) are marked with a green cross. For the latter two positions the largest and the smallest HIFI beam sizes are shown in green.
Current usage metrics show cumulative count of Article Views (full-text article views including HTML views, PDF and ePub downloads, according to the available data) and Abstracts Views on Vision4Press platform.
Data correspond to usage on the plateform after 2015. The current usage metrics is available 48-96 hours after online publication and is updated daily on week days.
Initial download of the metrics may take a while.