Fig. 11
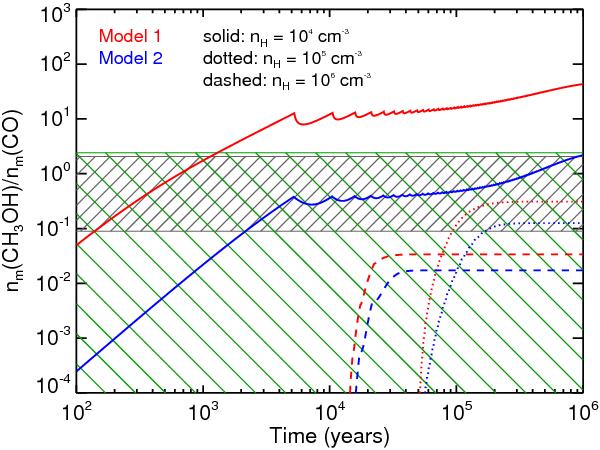
Mantle CH3OH/CO abundance ratio versus time. The red lines refer to Model 1 (Ea = 400 K and Ed/Eb = 0.65), the blue lines refer to Model 2 (Ea = 1450 K and Ed/Eb = 0.5) (see text). Solid, dotted and dashed lines refer to densities 104, 105 and 106 cm-3 respectively. The grey box with hatching shows the interval of CH3OH/CO abundance ratio observed towards high- and intermediate- mass protostars, while the green dashed box shows the values (upper limits) observed in low-mass protostars (Table 5).
Current usage metrics show cumulative count of Article Views (full-text article views including HTML views, PDF and ePub downloads, according to the available data) and Abstracts Views on Vision4Press platform.
Data correspond to usage on the plateform after 2015. The current usage metrics is available 48-96 hours after online publication and is updated daily on week days.
Initial download of the metrics may take a while.