Fig. 9

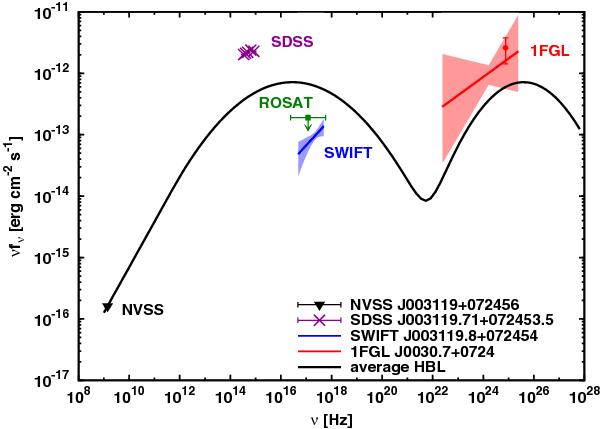
Energy spectra of 1FGL J0030.7+0724 (solid red line) and the favoured radio (filled black triangle), optical (violet crosses, dereddened ugriz magnitudes), and X-ray (solid blue line) counterparts, together with the SED of an average HBL (solid black line). The SED was adapted from Donato et al., assuming the average redshift of known HBLs z = 0.25 (Donato et al. 2001), and is normalised to the radio flux of NVSS J003119+072456. The frequency-dependent energy flux νfν is given in the observer’s frame. Note that the statistical errors of the radio and optical data points are too low to be resolved in the figure. Statistical uncertainties of the X- and γ-ray spectra are indicated by the corresponding shaded areas, which we derived with Eq. (1) in Abdo et al. (2009b). The filled red circle indicates the catalogued high-energy flux from Fermi-LAT. Observations with ROSAT provide an upper limit on the X-ray flux at the nominal position of 1FGL J0030.7+0724 between 0.1 and 2.4 keV, which is depicted by the green square (95% c.l., assuming Γ = 2.0, Borm 2010).
Current usage metrics show cumulative count of Article Views (full-text article views including HTML views, PDF and ePub downloads, according to the available data) and Abstracts Views on Vision4Press platform.
Data correspond to usage on the plateform after 2015. The current usage metrics is available 48-96 hours after online publication and is updated daily on week days.
Initial download of the metrics may take a while.


