Fig. 6
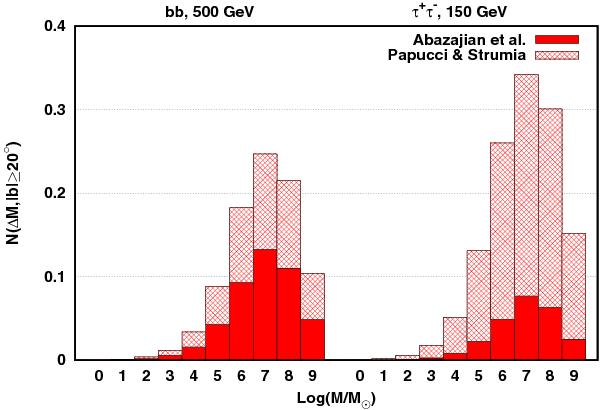
Expected number of one-year detectable subhaloes per mass decade at |b| ≥ 20°. The subhaloes′ mass and spatial distributions were adopted from Aquarius (Appendix C) while the SHM concentration was used. Mmin = 10-6 M⊙. The number corresponding to the  WIMP model is shown in the left (right) panel. The mass assigned to each bar denotes the geometric mean of the interval. Red and red-patterned bars show the number considering observational constraints on ⟨ σv ⟩ eff by Abazajian et al. (2010) and Papucci & Strumia (2010), respectively.
Current usage metrics show cumulative count of Article Views (full-text article views including HTML views, PDF and ePub downloads, according to the available data) and Abstracts Views on Vision4Press platform.
Data correspond to usage on the plateform after 2015. The current usage metrics is available 48-96 hours after online publication and is updated daily on week days.
Initial download of the metrics may take a while.