Fig. 5
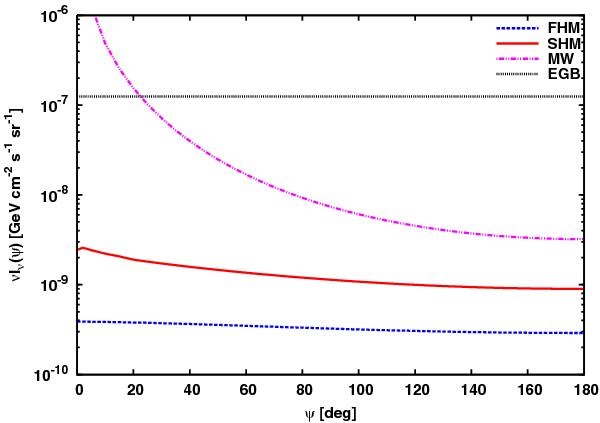
Average diffuse γ-ray flux from DM annihilation in the Galaxy as function of the angle between the observational and Galactic Centre direction ψ. The fluxes from the host halo (double-dot-dashed magenta line), FHM (dashed blue line), and SHM subhaloes (solid red line) are depicted. Each curve was derived at the peak energy of νIν(E) (40 GeV) assuming total annihilation in τ+τ− with mχ = 150 GeV and ⟨ σv ⟩ eff = ⟨ σv ⟩ 0. The minimum subhalo mass used was Mmin = 10-6 M⊙ (see Appendix C). The EGB at 40 GeV is shown by the dotted black line.
Current usage metrics show cumulative count of Article Views (full-text article views including HTML views, PDF and ePub downloads, according to the available data) and Abstracts Views on Vision4Press platform.
Data correspond to usage on the plateform after 2015. The current usage metrics is available 48-96 hours after online publication and is updated daily on week days.
Initial download of the metrics may take a while.