Fig. B.1
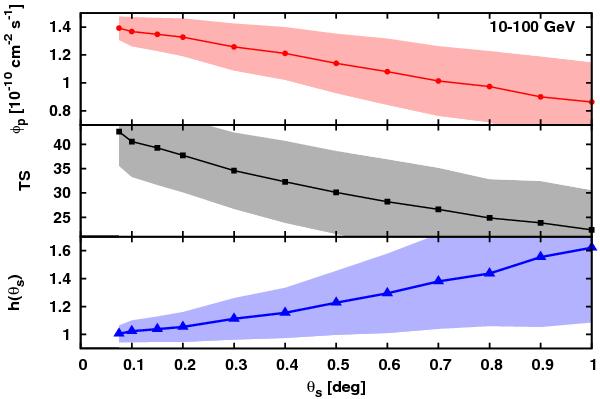
Average (solid lines) and rms (shaded areas) of φp(10 − 100 GeV) (upper panel), TS (middle panel), and the scaling h(θs) (lower panel) as function of the intrinsic angular extent θs. For each θs, a sample of 500 simulations of the 1FGL J0030.7+0724 photon distribution between 10 and 100 GeV assuming a DM subhalo intensity profile was analysed with the 1FGL point-source-analysis framework.
Current usage metrics show cumulative count of Article Views (full-text article views including HTML views, PDF and ePub downloads, according to the available data) and Abstracts Views on Vision4Press platform.
Data correspond to usage on the plateform after 2015. The current usage metrics is available 48-96 hours after online publication and is updated daily on week days.
Initial download of the metrics may take a while.