Free Access
Fig. 8
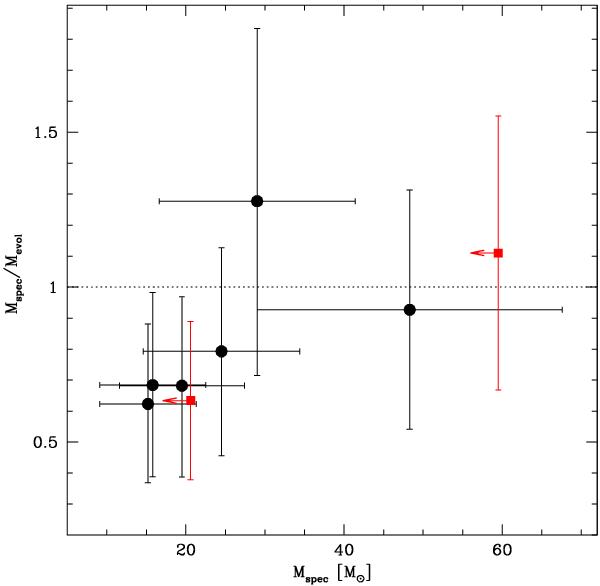
Ratio of spectroscopic to evolutionary masses versus spectroscopic masses for the sample stars. The dotted line is the one to one relation. Black circles are single stars, red squares are members of binary systems. The insert shows the position of the primary component of HD 48099.
Current usage metrics show cumulative count of Article Views (full-text article views including HTML views, PDF and ePub downloads, according to the available data) and Abstracts Views on Vision4Press platform.
Data correspond to usage on the plateform after 2015. The current usage metrics is available 48-96 hours after online publication and is updated daily on week days.
Initial download of the metrics may take a while.