Fig. 6
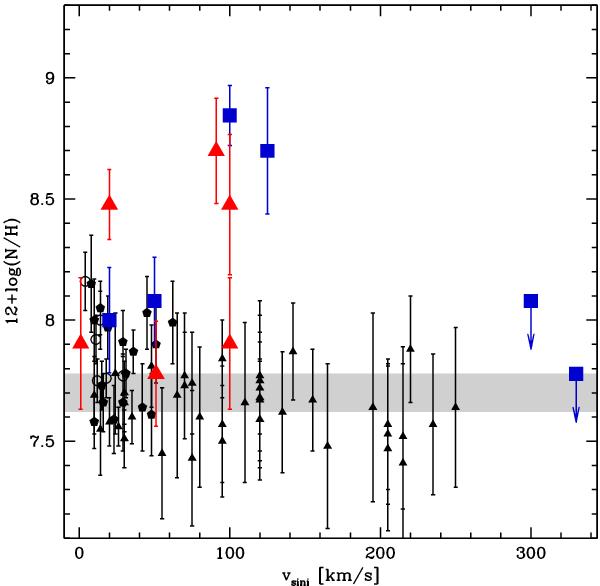
Nitrogen surface abundance (in units of 12 + log(N/H)) as a function of projected rotational velocity. Single O stars are the blue squares and binaries the red triangles. The small black triangles (pentagons, open circles) are the Galactic B stars of (Hunter et al. 2009; Morel et al. 2008; Przybilla et al. 2010) with log g larger than 3.5 (i.e. comparable to our sample). The grey area corresponds to the range of solar values from studies of the Sun, B stars and HII regions (see Table 3 of Hunter et al. 2009).
Current usage metrics show cumulative count of Article Views (full-text article views including HTML views, PDF and ePub downloads, according to the available data) and Abstracts Views on Vision4Press platform.
Data correspond to usage on the plateform after 2015. The current usage metrics is available 48-96 hours after online publication and is updated daily on week days.
Initial download of the metrics may take a while.