Free Access
Fig. 4
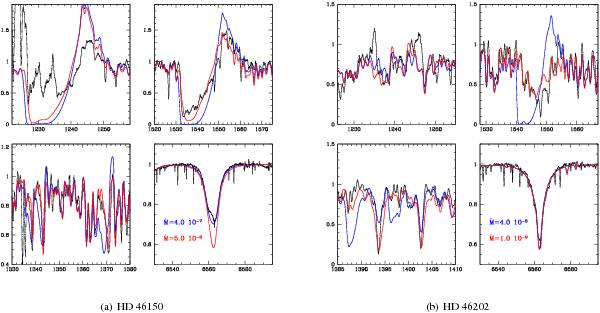
Comparison between the best-fit models of the UV spectrum (red lines) and models with higher mass-loss rates (blue lines). The solid lines are the observed spectra. The left panel shows the comparison for HD 46150, the right panel for HD 46202. The narrow absorption features in the C iv 1548–1550 profiles are interstellar.
This figure is made of several images, please see below:
Current usage metrics show cumulative count of Article Views (full-text article views including HTML views, PDF and ePub downloads, according to the available data) and Abstracts Views on Vision4Press platform.
Data correspond to usage on the plateform after 2015. The current usage metrics is available 48-96 hours after online publication and is updated daily on week days.
Initial download of the metrics may take a while.