Fig. 15
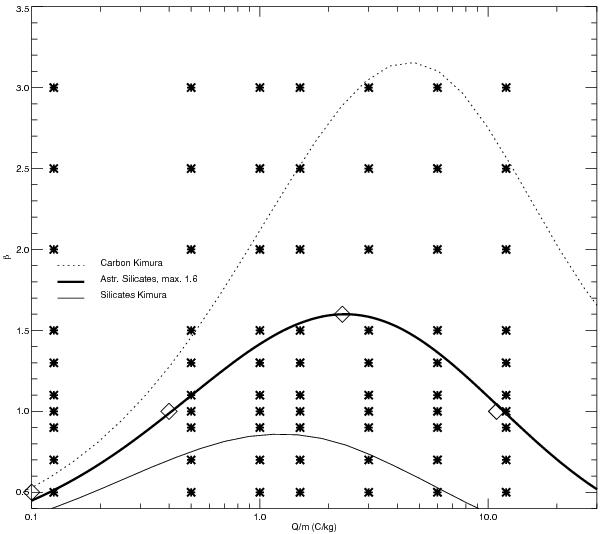
Overview of the simulations performed with various β and Q/m values. All simulations are done between 2010 and 2030, where densities and fluxes are binned per 100 days, and in a region of the solar system in a box of 22 AU around the Sun. The crosses denote these simulations (β and Q/m range), while the curves are three examples of β-curves: two from Kimura & Mann (1999) and one “adapted” astronomical silicates curve (Gustafson 1994). The β-curves relate the β-parameter of a material to its size. The sizes are consequently converted in corresponding charge-to-mass ratio, assuming a surface potential of +5 V and the material density according to the corresponding material (see Eq. (20)). The diamonds on the adapted astronomical silicates curve are 4 out of the 5 parameter combinations given in Table 3, that illustrate “realistic” sets of parameters for one material and their relation to particle size.
Current usage metrics show cumulative count of Article Views (full-text article views including HTML views, PDF and ePub downloads, according to the available data) and Abstracts Views on Vision4Press platform.
Data correspond to usage on the plateform after 2015. The current usage metrics is available 48-96 hours after online publication and is updated daily on week days.
Initial download of the metrics may take a while.