| Issue |
A&A
Volume 538, February 2012
|
|
|---|---|---|
| Article Number | A51 | |
| Number of page(s) | 14 | |
| Section | Interstellar and circumstellar matter | |
| DOI | https://doi.org/10.1051/0004-6361/201116838 | |
| Published online | 31 January 2012 | |
Rotational spectrum of a chiral amino acid precursor, 2-aminopropionitrile, and searches for it in Sagittarius B2(N)⋆,⋆⋆
1 Centre for Theoretical and Computational Chemistry (CTCC), Department of Chemistry, University of Oslo, PO Box 1033, Blindern, 0315 Oslo, Norway
2 Laboratoire de Physique des Lasers, Atomes, et Molécules, UMR CNRS 8523, Université de Lille I, 59655 Villeneuve d’Ascq Cedex, France
e-mail: This email address is being protected from spambots. You need JavaScript enabled to view it.
3 Max-Planck Institut für Radioastronomie, Auf dem Hügel 69, 53121 Bonn, Germany
4 Sciences Chimiques de Rennes, École Nationale Supérieure de Chimie de Rennes, CNRS, UMR 6226, Avenue du Général Leclerc, CS 50837, 35708 Rennes Cedex 7, France
e-mail: This email address is being protected from spambots. You need JavaScript enabled to view it.
Received: 6 March 2011
Accepted: 13 October 2011
Abstract
Context. No chiral molecule has been detected in the interstellar medium (ISM) so far.
Aims. A good candidate for an interstellar detection is 2-aminopropionitrile (CH3CH(NH2)CN), a chiral molecule with a C3H6N2 formula. The first member of this series, aminoacetonitrile (H2NCH2CN), was recently detected, demonstrating that at least one aminonitrile exists in the ISM.
Methods. Experimental spectra of 2-aminopropionitrile have been recorded in the microwave and submm energy range (8–80 GHz, 150–660 GHz). Ab initio calculations facilitated the assignment of the ground state of the most stable conformer and its five lowest excited vibrational states. An unbiased spectral survey of the 80–116 GHz atmospheric window performed with the IRAM 30 m telescope was used to search for this molecule in the hot core Sgr B2(N). This survey was analyzed in the local thermodynamical equilibrium (LTE) approximation. The emission of 2-aminopropionitrile was modeled simultaneously with the emission of all molecules known in Sgr B2(N), which allowed us to properly take into account line blending and avoid misassignments.
Results. More than 4000 lines of the ground state and the five lowest excited vibrational states (from 185 to 375 cm-1) were assigned in the experimental spectrum. The partition function including the vibrational contribution of these states was calculated. Only ten groups of transitions of 2-aminopropionitrile are not severely affected by line blending in the Sgr B2(N) spectrum. Six of them could be considered as tentatively detected but the LTE predictions of the four remaining groups are not (or only marginally) consistent with the observed spectrum. Therefore, only an upper limit of 1.7 × 1016 cm-2 can be securely derived for the column density of 2-aminopropionitrile toward Sgr B2(N), assuming the same source size, temperature, linewidth, and systemic velocity as for aminoacetonitrile
Conclusions. 2-aminopropionitrile is at least 1.8 times less abundant than aminoacetonitrile. A simple comparison to the pair methyl cyanide (CH3CN)/ethyl cyanide (CH3CH2CN) detected toward Sgr B2(N) suggests that 2-aminopropionitrile should be 3.5 times less abundant than aminoacetonitrile, which is consistent with the limit derived here.
Key words: astrochemistry / ISM: molecules / submillimeter: ISM / line: identification / astronomical databases: miscellaneous / ISM: individual objects: Sagittarius B2
Appendices are available at http://www.aanda.org
Full Table 1 is only available at the CDS via anonymous ftp to cdsarc.u-strasbg.fr (130.79.128.5) or via http://cdsarc.u-strasbg.fr/viz-bin/qcat?J/A+A/538/A51
© ESO, 2012
1. Introduction
It is usually proposed that life on the primitive Earth developed from simple prebiotic organic materials. However, it is more difficult to know where the chemical evolution occured that produced an initial reservoir containing amino acids, sugars, and many other compounds. The early Earth, the pre-solar nebula, or the interstellar medium (ISM) have been proposed independently as the reaction medium. The organic material could accordingly have been produced on Earth starting from simpler compounds or delivered to Earth by meteorites and comets during the phase of bombardment, and probably both occurred (Joyce et al. 1984; Bailey et al. 1998). The discovery of more and more complex molecules in the ISM supports the hypothesis of an initial material contained in this medium, even if this does not prove the origin of the molecules of the primitive Earth.
About 150 molecules and more than one hundred isotopologues have been detected in the ISM up to date1. Simple molecules like acetaldehyde (CH3CHO), hydrogen cyanide (HCN), or ammonia (NH3) are some of them but also anions, cations, radicals or inorganic compounds are present. No branched or chiral molecules have been detected. The complexity of the detected molecules is up to now limited to compounds with less than 14 atoms except for the recent detection of C60 and C70 in reflection nebulae (Sellgren et al. 2010; Cami et al. 2010). A huge amount of studies have been conducted to find the building blocks of life, and the detection of the simplest amino acid, glycine (H2NCH2COOH), has been erroneously reported several times (Snyder et al. 2005). Up to now, only one sugar, glycolaldehyde (HOCH2CHO), has been unambiguously identified (Hollis et al. 2000).
Some molecules are chiral, which means that they have two geometrical mirror-image forms that cannot be superimposed on each other. Chiral compounds play a particular role because life on Earth is to a significant part based on such compounds and on the homochirality of many of them, particularly the amino acids and sugars. Up to now, these chiral compounds, in abundance on Earth, have only been observed in meteorites generally after an aqueous acidic treatment. Unsuccessful attempts to discover a first chiral compound in the ISM have already been reported, and propylene epoxyde (H2C(O)CHCH3) was the target (Jones et al. 2007; Cunningham et al. 2007). Many other chiral compounds could be present in the ISM with substituents largely represented in the list of detected molecules (Marloie et al. 2010; Lattelais et al. 2009). Some of them are potential precursors of these building blocks of life.
Even if it is not possible to distinguish between different enantiomers in astronomical radio spectra, the presence and the abundance of these chiral compounds in the interstellar medium is of interest for understanding the origin of the chiral species encountered in meteorites and for discussing models of the possible interstellar origin of the enantiomeric excess that have been reported in these relics of early solar system chemistry (Pizzarello & Groy 2011; De Marcellus et al. 2010, and references therein). On the other hand, some of us have recently reported the microwave spectra of 3-amino-2-propenitrile (H2NCH=CHCN) (Askeland et al. 2006) and 3-mercapto-2-propenenitrile (HSCH=CHCN) (Cole et al. 2007). These two compounds are prochiral, which means that they can be converted into new and different chiral molecules in a single chemical step. And these compounds, which are adducts of ammonia or hydrogen sulfide (H2S) with cyanoacetylene (H-C ≡ C-CN), have been proposed as candidates for the ISM. We also tried to find a plausible reaction pathway for the formation in the ISM of the latter and of cyanoacetaldehyde (NCCH2CHO) (formally the rearranged product of the addition of water to HC3N) (Horn et al. 2008).
We report here the synthesis and the first study of the rotational spectrum of 2-aminopropionitrile (Fig. 1), and a search for this compound in the hot dense core Sagittarius B2(N), hereafter Sgr B2(N) for short, one of the currently best sources to search for new molecules in the interstellar medium. This chiral species has been selected on the basis of the recent interstellar detection of aminoacetonitrile in the ISM (Belloche et al. 2008a). In the laboratory, glycine can be formed by acidic aqueous treatment of aminoacetonitrile and alanine (CH3CH(NH2)COOH), the simplest chiral, natural amino acid, by hydrolysis of 2-aminopropionitrile (Béjaud et al. 1975). The physical and chemical properties of 2-aminopropionitrile are still poorly known. This compound is stable a few days at room temperature in the liquid phase. In the gas phase, a thermolysis study (Guillemin et al. 1988) has shown that it decomposes into HCN and CH3CH=NH at 800 °C. All molecules named in this article, except 2-aminopropionitrile which is in (Fig. 1), are drawn in Fig. A.1.
2. Experiments
2.1. Synthesis of 2-aminopropionitrile
The laboratory synthesis of 2-aminopropionitrile has already been reported (Guillemin et al. 1988). The scheme of the reaction is represented in Fig. A.2.
2.2. Oslo – Stark centimeter wave spectrometer
The microwave spectrum of 2-aminopropionitrile was studied in the 22–80 GHz frequency interval by Stark-modulation spectroscopy using the microwave spectrometer of the University of Oslo. Details of the construction and operation of this device have been given elsewhere (Møllendal et al. 2005, 2006). This spectrometer has a resolution of about 0.5 MHz and measures the frequency of isolated transitions with an estimated accuracy of ≈ 0.10 MHz. The experiments were performed at about –30 °C by cooling the 2 m Hewlett-Packard absorption cell with portions of dry ice. The cooling was performed to enhance the intensity of the spectrum.
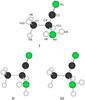 |
Fig. 1 Three stable conformers of 2-aminopropionitrile. Conformer I was calculated to be 8.0 kJ/mol more stable than II and 6.8 kJ/mol more stable than III employing the CCSD/cc-pVTZ procedure. The detailed CCSD structure is listed in the supporting information. Atom numbering is indicated on conformer I, which is the preferred form of this compound. |
2.3. Lille-submillimeter wave spectrometer
The submillimeter-wave measurements (150–660 GHz) were performed using the Lille spectrometer (Motiyenko et al. 2010). Solid-state sources were used in the frequency ranges 150–322 and 400–533 GHz. The frequency of the Agilent synthesizer (12.5–17.5 GHz) was first multiplied by six and amplified by a Spacek active sextupler providing the output power of +15 dBm in the W-band range (75–110 GHz). This power is high enough to use passive Schottky multipliers (X2, X3, X5) from Virginia Diodes Inc in the next stage of frequency multiplication chain. In the range from 580 to 660 GHz, the Istok backward wave oscillator (BWO) was used as a source of radiation. It is phase-locked to a harmonic of the Agilent E8257D synthesizer (2–20 GHz). As a detector we used an InSb liquid He-cooled bolometer from QMC Instruments Ltd to improve the sensitivity of the spectrometer, the sources were frequency modulated at 10 kHz. The absorption cell is a stainless-steel tube (6 cm diameter, 220 cm long). The sample pressure during measurements was about 2.5 Pa (25 μbar) and the linewidth was limited by Doppler broadening. These measurements were performed at room temperature. The measurement accuracy for isolated lines is estimated to be better than 30 kHz. However, if the lines were blended or had a poor signal-to-noise ratio, they were given a weight of 100 or even 200 kHz.
3. Quantum chemical calculations
3.1. Methods
The present ab initio and density functional theory (DFT) calculations were performed employing the Gaussian 03 suite of programs (Frisch et al. 2003) running on the Titan cluster in Oslo. Calculations were performed using three different methodologies, namely couple-cluster with single and double excitations (CCSD) (Purvis & Bartlett 1982), Møller-Plesset second-order perturbation calculations (MP2) (Møller & Plesset 1934), and density functional theory (DFT) calculations employing Becke′s three-parameter hybrid functional (Becke 1988) and the Lee, Yang and Parr correlation functional (B3LYP) (Lee et al. 1988). The Peterson and Dunnings (Peterson & Dunning 2002) correlation-consistent triple-ζ wave function cc-pVTZ was employed in the CCSD calculations, and this function augmented with diffuse functions, aug-cc-pVTZ, was used in the MP2 calculations. The 6-311++G(3df, 3pd) wave function, which is also of triple-ζ quality and augmented with diffuse functions, was employed in the B3LYP calculations. The default convergence criteria of Gaussian 03 were observed in all computations.
3.2. Results
Rotation about the C-NH2 bond that connects the amino group with the rest of the molecule may produce rotational isomerism. The quantum chemical calculations predict that three rotameric forms (conformers) exist for this compound. These conformers, denoted I, II, and III, are depicted in Fig. 1.
The structures, dipole moments, and energy differences were calculated for these forms at the very high CCSD/cc-pVTZ level of theory and the results are assumed to be accurate to within 3 kJ/mol. The full CCSD structures, dipole moment components, and energy differences, not corrected for zero-point vibrational effects, are given in Tables B.1 and B.2.
Interestingly, conformer I is predicted to be 7–8 kJ/mol (840–960 K) more stable than II or III in the CCSD calculations, so the two last conformers need not be considered further because their populations are presumably very insignificant under the conditions prevailing in the ISM. Not surprisingly, conformer I uses both hydrogen atoms of the amino group to form intramolecular hydrogen bonds with the π-electrons of the cyano group, just as in the case of its congener aminoacetonitrile (H2NCH2CN) (Macdonald & Tyler 1972; Pickett 1973), which has already been detected in the ISM (Belloche et al. 2008a).
Several additional calculations were performed, which include the potential function for rotation about the C-NH2 bond (Fig. A.3), which was calculated at the B3LYP/6-311++G(3df, 3pd) level, MP2/aug-cc-pVTZ calculations of the harmonic and anharmonic vibrational frequencies reported in Table B.3, Watson’s quartic centrifugal distortion constants (Watson 1977) and the vibration-rotation interaction constants (the α′s) (Gordy & Cook 1984) reported in Table B.4.
4. Analysis of the rotational spectrum
4.1. The microwave region
The CCSD/cc-pVTZ principal inertial axes dipole moment components of I were calculated to be μa = 2.92, μb = 0.22, and μc = 0.37 D (see Table B.2), which indicates that this form should have a comparatively strong a-type spectrum and very weak b- or c-type spectra. The spectrum of 2-aminopropionitrile was first observed in the microwave region and found to be comparatively simple, in accordance with these predictions. The assignment of a-type R-branch lines were readily made using the spectroscopic constants shown in Table 2 to predict their approximate frequencies.
The ground-state lines were accompanied by lines presumably belonging to vibrationally excited states: the anharmonic frequencies of the lowest vibrations are 184.7 cm-1 (265.8 K) for the lowest skeletal bending vibration (v27), 225.6 cm-1 (324.6 K) for the methyl torsion (v26), 238.2 cm-1 (342.7 K) for the amino group torsion (v25), and 282.7 cm-1 (406.8 K) for a skeletal bending mode (v24), according to the B3LYP calculations. Spectra of the first excited states of these fundamental vibrations were assigned. The spectrum of the second excited state of the lowest skeletal vibration (v27 = 2) was also assigned. The spectroscopic constants of these states are collected in Table 11. No splittings caused by torsion of the methyl group were observed for the ground and the first excited state of the methyl torsion (v26 = 1). The reason for this is that the coupling between the methyl group rotation, of the amino group rotation, and the overall rotation of the molecule, which might result in a resolved splitting of the microwave transitions, is comparatively small.
The assignments of these states were greatly facilitated by comparing the experimental vibration-rotation constants with their theoretical counterparts listed in Table B.4. Searches for the microwave spectra of the high-energy conformers II and III were performed using the CCSD spectroscopic constants (Table B.2) to predict the approximate frequencies of these spectra, but they were not identified, presumably because they were too weak owing to the very large energy differences (8.0 and 6.8 kJ/mol) between these hypothetical conformers and the preferred conformer I.
4.2. The submillimeterwave region
Thanks to the centimeterwave, the analysis of the spectra in the millimeter and submillimeterwave region was fairly easy to perform.
We note that some interaction between these lowest energy excited states (from 180 to 300 cm-1) occurs for high quantum numbers above 400 GHz. We had difficulties to obtain a very good fit. Nevertheless; it is possible to predict the excited states up to 400 GHz very reliablely. The complete list of measurements is given in Table 1, available at the CDS, for the ground state and the excited vibrational states. Only part of the table is presented in this paper.
Part of the table available in CDS, result of the fit for the ground state and the excited vibrational states.
The final spectroscopic parameters obtained for the ground state and the excited states are provided in Tables 2 and B.5. Table 2 also lists the parameters calculated with the ab initio harmonic force field. The agreement is pretty good. This shows that the ab initio calculations can be useful for the assignment of new rotational spectra.
Ground-state spectroscopic parameters of 2-aminopropioni-trile.
4.3. Partition function
When low-energy vibrationally excited states exist, the vibrational part of the partition function should be taken into account to derive column densities. Even at relatively low temperature (150 K) these states around 200 cm-1 are populated. The total partition function is given in Table 3. It was computed with the same approximation and equations as used by Widicus Weaver et al. (2005) for glycolaldehyde.
Partition function of 2-aminopropionitrile.
List of ten spectral features grouping transitions of 2-aminoproprionitrile observed toward Sgr B2(N).
5. Observations
We observed the hot-core region Sgr B2(N) in January 2004, September 2004, and January 2005 with the IRAM 30 m telescope on Pico Veleta, Spain. We carried out a complete spectral survey in the 3 mm atmospheric window between 80 and 116 GHz. A complete survey was performed in parallel in the 1.3 mm window between 201.8 and 204.6 GHz and between 205.0 and 217.7 GHz. Additional selected spectra were also obtained in the 2 mm window and between 219 and 268 GHz. The angular resolution depends on the frequency ν and can be computed with the equation HPBW(″) = 2460 / ν(GHz). The coordinates of the observed position are αJ2000 = 17h47m20 0, δJ2000 = − 28°22′19.0″ with a systemic velocity Vlsr = 64 km s-1. More details about the observational setup and the data reduction can be found in Belloche et al. (2008a). An rms noise level of 15–20 mK on the
  scale was achieved below 100 GHz, 20–30 mK between 100 and 114.5 GHz, about 50 mK between 114.5 and 116 GHz, and 25–60 mK in the 2 mm window. At 1.3 mm, the confusion limit was reached for most spectra.
6. Column density upper limit toward Sgr B2(N)
We searched for the transitions of 2-aminopropionitrile in our complete molecular line survey of Sgr B2(N) at 3 mm as well as in our partial surveys at 2 and 1.3 mm. The search was conducted in a systematic way by modeling the expected emission with the XCLASS program2 in the local thermodynamic equilibrium (LTE), which is certainly a good approximation for the rotational transitions in the vibrational ground state given the very high density characterizing the Sgr B2(N) hot core (~2 × 108 cm-3, see, e.g., Belloche et al. 2008a,b). Because the partition function of 2-aminopropionitrile includes the contribution of five vibrationally and torsionally excited states also in the LTE approximation, we may overestimate its total column density if the density is not sufficient to thermally populate these vibrationally and torsionally excited states via collisions. However, infrared excitation may also contribute to populate the vibrationally excited states (e.g. Nummelin & Bergman 1999), in which case we could underestimate the total column density. Finally, we cannot exclude that radiative decay involving ro-vibrational transitions may affect the rotational populations of the vibrational ground state. Since there is no easy way to correct for these possible non-LTE effects, we restrained our analysis to the LTE assumption. Because the spectrum of Sgr B2(N) is very close to the confusion limit, there are lines almost everywhere and the risk of misassignments is high. Therefore we used our complete model which includes all species detected in our survey so far (Belloche et al., in prep.; see Belloche et al. 2007, 2008a, 2009,for more details) to point out possible blends with transitions of other species.
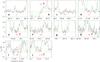 |
Fig. 2 Transitions of 2-aminopropionitrile tentatively detected toward Sgr B2(N) or possibly in conflict with the observed spectrum. The latter are indicated with a question mark. The spectrum taken with the IRAM 30 m telescope is shown in black on the main-beam temperature scale. The red spectrum is the LTE prediction for 2-aminopropionitrile based on the parameters listed in Table 5. The red labels are the feature numbers as in Col. 1 of Table 4. The green spectrum is the complete model that includes all molecules detected in the full line survey of Sgr B2(N) so far (except for 2-aminopropionitrile). |
Within the frequency ranges of our survey, 182 transitions of 2-aminopropionitrile are predicted to be stronger than 20 mK on the main-beam temperature scale, which is a conservative limit given the typical noise level of this survey (see Sect. 5). They are listed in Table C.1, along with comments indicating whether they are blended with species included in our complete model of Sgr B2(N). Among these transitions, only 25 are found to be relatively free of contamination, and these are listed in Table 4. All other transitions of 2-aminopropionitrile are heavily blended with transitions of other species and cannot be detected with our single-dish data. A few of the 25 transitions are very close to each other in frequency so that they cannot be separated given the velocity dispersion that characterizes the molecular emission in Sgr B2(N). As a result, these 25 transitions are grouped into ten features, as listed in Col. 1 of Table 4. The LTE modeled spectrum of 2-aminopropionitrile is compared to the observed spectrum in Fig. 2, along with the complete model that includes all species identified in our survey so far. The physical parameters of the 2-aminopropionitrile model are given in Table 5. We assumed the same source size, temperature, linewidth, and systemic velocity as for aminoacetonitrile (Belloche et al. 2008a).
Parameters of the LTE model of 2-aminopropionitrile.
On the one hand, six of the ten features displayed in Fig. 2 are consistent with the observed spectrum and could be claimed as detected (F1, F3, F4, F6, F7, and F9), especially since the baseline level is uncertain and may have been overestimated in a few cases because of line confusion (F3, F4, and F7). However, four of these features have a low signal-to-noise ratio in terms of integrated intensity (F1, F3, F4, and F7, see Col. 11 of Table 4), and one (F9) may be blended with a still unidentified line. As a result, we consider these six features as tentatively detected only.
On the other hand, the four remaining features (F2, F5, F8, and F10) seem at first glance to be inconsistent with the observed spectrum. Feature F2 is blended with a redshifted velocity component of HNC 1–0 seen in absorption. Because the depth of this absorption is unknown, it could be stronger than assumed in our complete model and could significantly absorb the potential line of 2-aminopropionitrile. We checked for signs of a stronger absorption at the velocity corresponding to this component in the absorption spectra of other species (HCN, HCO+, CS, c-C3H2) but did not find any clear evidence that would confirm this option. The status of F2 is therefore unclear. Feature F5 does not show any sign of detection but because the modeled feature is weak and the emission-free channels in this portion of the observed spectrum are quasi inexistent, the baseline could have been slightly overestimated (30 mK would be sufficient to remove the inconsistency). Even if it is predicted to be a slightly stronger than F5, the case of feature F10 is very similar: the level of the baseline could have been overestimated in the observed spectrum, which would remove the small inconsistency. Therefore, the apparent non-detection of these two features does not rule out a possible detection of 2-aminopropionitrile. Finally, feature F8 peaks between two well detected lines that are found to be blends of C2H513CN and (CH3)2CO for the lower-frequency one and 13CH3OH and C2H5OH for the higher-frequency one. The 2-aminopropionitrile feature does not have any observed counterpart at the position of its peak. The discrepancy in peak temperature is at the ~2σ level, but several channels show this inconsistency, so we believe it is significant. Because the baseline does not seem to have been overestimated in this part of the spectrum, F8 appears to be a more severe problem from than the three other features discussed above. As a result, we refrain claiming any tentative detection of aminopropionitrile and prefer to consider the LTE model of Table 5 as a sensitive ~3σ upper limit on the column density of this molecule.
7. Discussion
In Sect. 6 we derived a column density upper limit of 1.7 × 1016 cm-2 for 2-aminopropionitrile, assuming the source size, temperature, linewidth, and systemic velocity to be the same as for aminoacetonitrile. This number takes into account the contribution of the lowest energy vibrational-torsional modes3.
Belloche et al. (2009) reported an abundance ratio of 1.4 between methyl cyanide (CH3CN) and ethyl cyanide (C2H5CN) in Sgr B2(N). Because aminoacetonitrile and 2-aminopropionitrile are based on the same carbon chains as these two alkyl cyanides, but with an additional amine functional group, one could naively expect the same abundance ratio. However, the amine group is at the end of the chain in the former molecule, while it is bound to the central carbon in the latter. If the chemical pathway leading to 2-aminopropionitrile in the interstellar medium is the photodissociation of an hydrogen atom from ethyl cyanide followed by the addition of an amine radical, then the statistical likelyhood to find the amine on the central carbon would be 40% only, provided the photodissociation energy is the same for all hydrogen atoms in the chain. Following the analogy with the pair methyl/ethyl cyanide, we could then expect an abundance ratio of aminoacetonitrile to 2-aminopropionitrile of 3.5 (1.4/0.4), which would be consistent with the lower limit (>1.8) derived above for this chiral molecule we assumed the same source size, temperature, linewidth, and systemic velocity as for aminoacetonitrile.
8. Conclusion
We measured (in the range 8–660 GHz) for the first time the rotational spectra of 2-aminopropionitrile. With the help of ab initio calculations, more than 4000 lines from the ground and five excited vibrationally and torsionally states were assigned. The assignment of these low-energy excited states is very important for calculating the partition function. Omitting the vibrational-torsional part would underestimate the column density by 20% at 100 K.
2-aminopropionitrile was searched for in an unbiased, single-dish, spectral survey of the hot dense core Sgr B2(N). Six groups of transitions were tentatively detected in the 3 mm atmospheric window, but the LTE predictions for four other groups are not (or only marginally) consistent with the observed spectrum. As a result, only a column density upper limit of 1.7 × 1016 cm-2 could be derived for this chiral molecule. It is at least 1.8 times less abundant than aminoacetonitrile. A simple comparison to the pair methyl/ethyl cyanide detected toward Sgr B2(N) suggests that 2-aminopropionitrile should be 3.5 times less abundant than aminoacetonitrile, which is consistent with the limit derived here.
Online material
Appendix A: Figures of the molecules discussed in the paper, the synthesis of 2-aminopropionitrile, and the ab initio potential curve
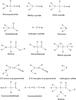 |
Fig. A.1 Structure of the molecules discussed in the article. |
 |
Fig. A.2 Scheme of the synthesis of 2-aminopropionitrile. |
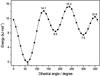 |
Fig. A.3 B3LYP/6-311++G(3df, 3pd) potential curve for the rotation about the C3-N4 bond. The abscissa is the H5-N4-C3-H11 dihedral angle. Conformer I has the lowest energy indicated by 0 kJ/mol for dihedral angle of 59.4°. Rotamer II is higher in energy by 8.5, and III by 7.5 kJ/mol relative to I. The corresponding dihedral angles are 179.9 and 320°, respectively. The maxima have higher energies than I by 14.1, 15.3, and 12.4 kJ/mol, respectively. The corresponding dihedral angles are 128.8, 236, and 348.9°, respectively. |
Appendix B: Tables of the results of ab initio calculations and spectroscopic parameters of the vibrationally excited states
CCSD/cc-pVTZ Structures of three conformers of CH3 CH(NH2)CN.
Harmonic and anharmonic vibrational fundamentals (in cm-1).
B3LYP/6-311++G(3df, 3pd) vibration-rotation α matrix (MHz) of conformer I.
Spectroscopic parameters of the vibrationally excited states.
Appendix C: Transitions of 2-aminopropionitrile observed with the IRAM 30 m telescope toward Sgr B2(N)
Transitions of 2-aminopropionitrile observed with the IRAM 30 m telescope toward Sgr B2(N).
We made use of the XCLASS program (http://www.astro.uni-koeln.de/projects/schilke/XCLASS), which accesses the CDMS (Müller et al. 2001, 2005, http://www.cdms.de) and JPL (Pickett et al. 1998, http://spec.jpl.nasa.gov) molecular databases.
At 100 K, the full partition function is 1.21 times larger than the partition function of the ground state. Because aminoacetonitrile was detected with a column density of 3.0 × 1016 cm-2 (after taking into account the contribution of the lowest-energy vibrational modes to the partition function, see Belloche et al. 2008a; Braakman et al. 2010), 2-aminopropionitrile is at least 1.8 times less abundant than aminoacetonitrile in Sgr B2(N).
Acknowledgments
We thank Rob Garrod for enlightening discussions about the interstellar chemistry. This work was supported by the Programme National “Physique et Chimie du Milieu Interstellaire”. A.K. thanks The Research
Council of Norway for financial assistance through Contract 177540/V30. J.-C.G. thanks also the Centre National d’Études Spatiales (CNES) and the Program EPOV (INSU-CNRS) for financial support.
References
- Askeland, E., Møllendal, H., Uggerud, E., et al. 2006, J. Phys. Chem. A, 110, 12572 [CrossRef] [Google Scholar]
- Bailey, J., Chrysostomou, A., Hough, J. H., et al. 1998, Science, 281, 672 [NASA ADS] [CrossRef] [Google Scholar]
- Becke, A. D. 1988, Phys. Rev. A, 38, 3098 [Google Scholar]
- Béjaud, M., Mion, L., Taillades, J., & Commeyras, A. 1975, Tetrahedron, 31, 403 [CrossRef] [Google Scholar]
- Belloche, A., Comito, C., Hieret, C., et al. 2007, in Molecules in Space and Laboratory, ed. J. L. Lemaire, & F. Combes [Google Scholar]
- Belloche, A., Menten, K. M., Comito, C., et al. 2008a, A&A, 482, 179 [NASA ADS] [CrossRef] [EDP Sciences] [Google Scholar]
- Belloche, A., Menten, K. M., Comito, C., et al. 2008b, A&A, 492, 769 [NASA ADS] [CrossRef] [EDP Sciences] [Google Scholar]
- Belloche, A., Garrod, R. T., Müller, H. S. P., et al. 2009, A&A, 499, 215 [NASA ADS] [CrossRef] [EDP Sciences] [Google Scholar]
- Braakman, R., Blake, G. A., Belloche, A., & Menten, K. M. 2010, ApJ, 724, 994 [NASA ADS] [CrossRef] [Google Scholar]
- Cami, J., Bernard-Salas, J., Peeters, E., & Malek, S. E. 2010, Science, Sept., 1180 [Google Scholar]
- Cole, G. C., Møllendal, H., Khater, B., & Guillemin, J. C. 2007, J. Phys. Chem. A, 111, 1259 [NASA ADS] [CrossRef] [Google Scholar]
- Cunningham, M. R., Jones, P. A., Godfrey, P. D., et al. 2007, MNRAS, 376, 1201 [NASA ADS] [CrossRef] [Google Scholar]
- De Marcellus, P., Meinert, C., Nuevo, M., et al. 2010, ApJ, 727, L27 [Google Scholar]
- Frisch, M. J., Trucks, G. W., Schlegel, H. B., et al. 2003, Gaussian 03, revision B.03, Gaussian, Inc., Pittsburgh PA [Google Scholar]
- Gordy, W., & Cook, R. L. 1984, Microwave Molecular Spectra, In Techniques of Chemistry (New York: John Wiley & Sons), Vol. XVII [Google Scholar]
- Guillemin, J. C., & Denis, J. M. 1988, Tetrahedron, 44, 4431 [CrossRef] [Google Scholar]
- Hollis, J. M., Lovas, F. J., & Jewell, P. R. 2000, ApJ, 540, L107 [NASA ADS] [CrossRef] [Google Scholar]
- Horn, A., Møllendal, H., & Guillemin, J. C. 2008, J. Phys. Chem. A, 112, 11009 [CrossRef] [Google Scholar]
- Joyce, G. F., Visser, G. M., Van Boeckel, C. A. A., et al. 1984, Nature, 310, 602 [NASA ADS] [CrossRef] [Google Scholar]
- Jones, P. A., Cunningham, M. R., Godfrey, P. D., & Cragg, D. M. 2007, MNRAS, 374, 579 [NASA ADS] [CrossRef] [Google Scholar]
- Kuan, Y. J., Charnley, S. B., Huang, H. C., Tseng, W. L., & Kisiel, Z. 2003, ApJ, 593, 848 [NASA ADS] [CrossRef] [Google Scholar]
- Lattelais, M., Pauzat, F., Ellinger, Y., & Cecccarelli, C. 2009, ApJ, 696, L133 [Google Scholar]
- Lee, C., Yang, W., & Parr, R. G. 1988, Phys. Rev. B, 37, 785 [Google Scholar]
- Macdonald, J. N., & Tyler, J. K. 1972, J. Chem. Soc. Chem. Commun., 17, 995 [CrossRef] [Google Scholar]
- Marloie, G., Lattelais, M., Pauzat, F., Pilme, J., & Ellinger, Y. 2010, Interdisc. Sci. Comput. Life Sci., 2, 48 [CrossRef] [Google Scholar]
- Møllendal, H., Leonov, A., & de Meijere, A. 2005, J. Phys. Chem. A, 109, 6344 [CrossRef] [Google Scholar]
- Møllendal, H., Cole, G. C., & Guillemin, J. C. 2006, J. Phys. Chem. A, 110, 921 [CrossRef] [Google Scholar]
- Møller, C., & Plesset, M. S. 1934, Phys. Rev., 46, 618 [NASA ADS] [CrossRef] [Google Scholar]
- Motiyenko, R. A., Margulès, L., Alekseev, E. A., Guillemin, J. C., & Demaison, J. 2010, J. Mol. Spectrosc., 264, 94 [Google Scholar]
- Müller, H. S. P., Thorwirth, S., Roth, D. A., & Winnewisser, G. 2001, A&A, 370, L49 [NASA ADS] [CrossRef] [EDP Sciences] [Google Scholar]
- Müller, H. S. P., Schlöder, F., Stutzki, J., & Winnewisser, G. 2005, J. Mol. Struct., 742, 215 [NASA ADS] [CrossRef] [Google Scholar]
- Nummelin, A., & Bergman, P. 1999, A&A, 341, L59 [NASA ADS] [Google Scholar]
- Peterson, K. A., & Dunning, T. H., Jr. 2002, J. Chem. Phys., 117, 10548 [NASA ADS] [CrossRef] [Google Scholar]
- Pickett, H. M. 1973, J. Mol. Spectrosc., 46, 335 [Google Scholar]
- Pickett, H. M., Poynter, I. R. L., Cohen, E. A., et al. 1998, J. Quant. Spectrosc. Radiat. Transfer, 60, 883 [Google Scholar]
- Pizzarello, S., & Groy, T. L. 2011, Geochem. Cosmochim. Acta, 75, 645 [Google Scholar]
- Purvis, G. D., III, & Bartlett, R. J. 1982, J. Chem. Phys., 76, 1910 [NASA ADS] [CrossRef] [Google Scholar]
- Sellgren, K., Werner, M. W., Ingalls, J. G., et al. 2010, ApJ, 722, L54 [NASA ADS] [CrossRef] [Google Scholar]
- Snyder, L. E., Lovas, F. J., Hollis, J. M., et al. 2005, ApJ, 619, 914 [NASA ADS] [CrossRef] [Google Scholar]
- Watson, J. K. G. 1977, Vibrational Spectra and Structure (Amsterdam: Elsevier) [Google Scholar]
- Widicus Weaver, S. L., Butler, R. A. H., Drouin, B. J., et al. 2005, ApJS, 158, 188 [NASA ADS] [CrossRef] [Google Scholar]
All Tables
Part of the table available in CDS, result of the fit for the ground state and the excited vibrational states.
List of ten spectral features grouping transitions of 2-aminoproprionitrile observed toward Sgr B2(N).
Transitions of 2-aminopropionitrile observed with the IRAM 30 m telescope toward Sgr B2(N).
All Figures
|
Fig. 1 Three stable conformers of 2-aminopropionitrile. Conformer I was calculated to be 8.0 kJ/mol more stable than II and 6.8 kJ/mol more stable than III employing the CCSD/cc-pVTZ procedure. The detailed CCSD structure is listed in the supporting information. Atom numbering is indicated on conformer I, which is the preferred form of this compound. |
| In the text | |
|
Fig. 2 Transitions of 2-aminopropionitrile tentatively detected toward Sgr B2(N) or possibly in conflict with the observed spectrum. The latter are indicated with a question mark. The spectrum taken with the IRAM 30 m telescope is shown in black on the main-beam temperature scale. The red spectrum is the LTE prediction for 2-aminopropionitrile based on the parameters listed in Table 5. The red labels are the feature numbers as in Col. 1 of Table 4. The green spectrum is the complete model that includes all molecules detected in the full line survey of Sgr B2(N) so far (except for 2-aminopropionitrile). |
| In the text | |
|
Fig. A.1 Structure of the molecules discussed in the article. |
| In the text | |
|
Fig. A.2 Scheme of the synthesis of 2-aminopropionitrile. |
| In the text | |
|
Fig. A.3 B3LYP/6-311++G(3df, 3pd) potential curve for the rotation about the C3-N4 bond. The abscissa is the H5-N4-C3-H11 dihedral angle. Conformer I has the lowest energy indicated by 0 kJ/mol for dihedral angle of 59.4°. Rotamer II is higher in energy by 8.5, and III by 7.5 kJ/mol relative to I. The corresponding dihedral angles are 179.9 and 320°, respectively. The maxima have higher energies than I by 14.1, 15.3, and 12.4 kJ/mol, respectively. The corresponding dihedral angles are 128.8, 236, and 348.9°, respectively. |
| In the text | |
Current usage metrics show cumulative count of Article Views (full-text article views including HTML views, PDF and ePub downloads, according to the available data) and Abstracts Views on Vision4Press platform.
Data correspond to usage on the plateform after 2015. The current usage metrics is available 48-96 hours after online publication and is updated daily on week days.
Initial download of the metrics may take a while.