Fig. 2
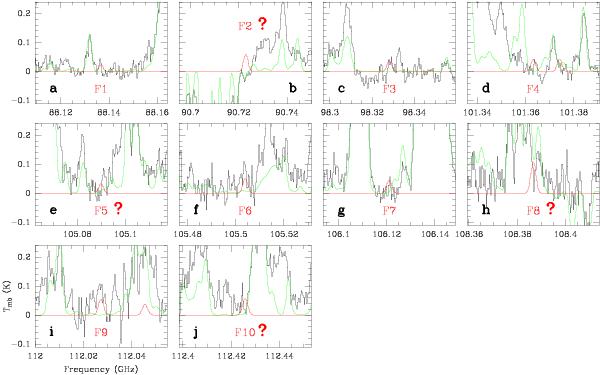
Transitions of 2-aminopropionitrile tentatively detected toward Sgr B2(N) or possibly in conflict with the observed spectrum. The latter are indicated with a question mark. The spectrum taken with the IRAM 30 m telescope is shown in black on the main-beam temperature scale. The red spectrum is the LTE prediction for 2-aminopropionitrile based on the parameters listed in Table 5. The red labels are the feature numbers as in Col. 1 of Table 4. The green spectrum is the complete model that includes all molecules detected in the full line survey of Sgr B2(N) so far (except for 2-aminopropionitrile).
Current usage metrics show cumulative count of Article Views (full-text article views including HTML views, PDF and ePub downloads, according to the available data) and Abstracts Views on Vision4Press platform.
Data correspond to usage on the plateform after 2015. The current usage metrics is available 48-96 hours after online publication and is updated daily on week days.
Initial download of the metrics may take a while.