| Issue |
A&A
Volume 537, January 2012
|
|
|---|---|---|
| Article Number | L10 | |
| Number of page(s) | 4 | |
| Section | Letters | |
| DOI | https://doi.org/10.1051/0004-6361/201118308 | |
| Published online | 20 January 2012 | |
Detection of HF emission from the Orion Bar⋆
1 SRON Netherlands Institute for Space Research, Landleven 12, 9747 AD Groningen, The Netherlands
e-mail: vdtak@sron.nl
2 Kapteyn Institute, University of Groningen, The Netherlands
3 KOSMA, I. Physik. Inst., Universität zu Köln, Germany
4 UJF-Grenoble 1/CNRS, Institut de Planétologie et d’Astrophysique de Grenoble, France
5 Dept. of Astronomy, University of Michigan, Ann Arbor, USA
Received: 21 October 2011
Accepted: 15 December 2011
Context. The clumpy density structure of photon-dominated regions is well established, but the physical properties of the clumps and of the surrounding interclump medium are only approximately known.
Aims. The aim of this paper is to constrain the physical and chemical conditions in the Orion Bar, a prototypical nearby photon-dominated region.
Methods. We present observations of the HF J = 1–0 line, which appears in emission toward the Orion Bar, and compare the brightness of the line to non-LTE radiative transfer calculations.
Results. The large width of the HF line suggests an origin of the emission in the interclump gas, but collisional excitation by H2 in the interclump gas underpredicts the observed line intensity by factors of 3–5. In contrast, an origin of the line in the dense clumps requires a density of ~109 cm-3, 10–100 times higher than previous estimates, which is unlikely. However, electron impact excitation reproduces our observations for T = 100 K and ne = 10 cm-3, as expected for the interclump gas.
Conclusions. We conclude that HF emission is a signpost of molecular gas with a high electron density. Similar conditions may apply to active galactic nuclei, where HF also appears in emission.
Key words: astrochemistry / ISM: molecules
© ESO, 2012
1. Introduction
Photon-dominated regions (PDRs) are the surface regions of molecular clouds, where ultraviolet radiation with photon energies between a few and 13.6 eV drives the thermal and chemical balance of the gas (Hollenbach & Tielens 1999). This situation occurs in regions of high-mass star formation, but also in protoplanetary disks and in the nuclei of active galaxies. Studying the structure of PDRs therefore has a wide astrophysical application. In PDRs, gas heating proceeds by photo-electric emission from dust grains, while the main cooling channels are the fine structure lines of C+ and O and the rotational lines of CO (Kaufman et al. 1999). Absorption of the impinging ultraviolet radiation by dust and gas in the PDR creates a layered structure, where chemical transitions such as H+ → H → H2 and C+ → C → CO occur.
The Orion Bar is a prototypical PDR, located between the Orion molecular cloud and the Orion Nebula, the H+ region surrounding the Trapezium stars, at a distance of 414 pc (Menten et al. 2007). Observations at infrared and submillimeter wavelengths indicate a geometry for the Bar where the PDR is wrapped around the Orion Nebula, and changes from a face-on to an edge-on view where the molecular emission peaks (Hogerheijde et al. 1995; Walmsley et al. 2000). The mean temperature of the molecular gas in the Bar is 85 K, while the temperature rises to several 100 K toward the ionization front, where the emission from PAH particles and vibrationally excited H2 peaks.
While the temperature structure of the Orion Bar is reasonably well understood, the same cannot be said about the density structure. The mean density of the molecular gas is 105 cm-3, but single-dish observations already indicate the presence of small-scale density variations without apparent pattern, usually called “clumps” (Hogerheijde et al. 1995) that are also seen toward other PDRs (Stutzki et al. 1988; Wang et al. 1993). While interferometric observations have confirmed the presence of clumps (Young Owl et al. 2000), the densities of both the clumps and the interclump medium are somewhat uncertain. The interclump medium probably has a density between a few 104 and 2 × 105 cm-3 (Simon et al. 1997), while estimates of the clump density range from 1.5 × 10⁶ to 6 × 106 cm-3 (Lis & Schilke 2003).
This Letter presents observations of the HF J = 1–0 line, which appears in emission toward the Orion Bar. The HF molecule is expected to be the dominant carrier of gas-phase fluorine, because the reaction F + H2 → HF + H is exothermic. For diffuse clouds where the effect of depletion on grains should be unimportant, models by Neufeld & Wolfire (2009) predict an HF abundance of ~3.6 × 10⁻⁸ relative to H2. Recent observations of the HF 1–0 line confirm this prediction: the line is seen in absorption toward several background sources, indicating abundances of ~1–2 × 10⁻⁸ (Neufeld et al. 2010). Toward dense clouds, the abundance is measured to be ~100 times lower (Phillips et al. 2010), suggesting that depletion of F on grain surfaces or excitation effects play a role.
Like CO, HF is a linear rotor with a regular line spectrum, where ν = 2B(J + 1) and Aij ∝ ν3. Unlike CO, HF has a small reduced mass and a large dipole moment, so that the lines have high frequencies and radiative decay is rapid. In particular, the HF 1–0 line has a frequency of 1232 GHz and an Einstein A coefficient of 2.422 × 10⁻² s-1. Thermal excitation of the J = 1 level of HF thus requires extremely high gas densities, which is why the line usually appears in absorption (Sonnentrucker et al. 2010; Monje et al. 2011a).
2. Observations and data reduction
The observations were made with the Heterodyne Instrument for the Far-Infrared (HIFI; De Graauw et al. 2010) onboard ESA’s Herschel Space Observatory (Pilbratt et al. 2010) on 2011 March 19, as part of the Guaranteed Time key program Herschel Observations of Extraordinary Sources (HEXOS; Bergin et al. 2010). Receiver band 5b was used as front end and the acousto-optical Wide-Band Spectrometer (WBS), which covers 4 GHz bandwidth in four 1140 MHz subbands at 1.1 MHz (0.30 km s-1) resolution, as back end. The data were taken in spectral survey mode with a redundancy of 6, using the frequency switch technique with a throw of 100 MHz.
The position observed is the CO+ peak of the Orion Bar at α = 05h35m20.6s, δ = −05°25′14″ (J2000) (Störzer et al. 1995). The FWHM beam size at the observing frequency is 17.3 arcsec (Roelfsema et al. 2012), which corresponds to 7200 AU at the distance of Orion. The system temperature for these data is 2571 K in SSB main beam units, and the integration time is 70 min (ON+OFF).
Calibration of the data, removal of standing waves, and sideband deconvolution were performed in the Herschel Interactive Processing Environment (HIPE) version 6.0. The subsequent analysis was performed within the CLASS1 package, version January 2011. The calibration is estimated to be accurate to ≈ 10%; the velocity scale should be accurate to 0.5 km s-1 or better. The intensity scale was converted to Tmb using a main beam efficiency of 64% (Roelfsema et al. 2012). Only a linear baseline was subtracted. After inspection, data from the two polarizations were averaged together to obtain an rms noise level of 0.18 K in Tmb units on 0.5 MHz channels.
3. Results
Figure 1 presents the HF line profile observed toward the Orion Bar. Strong emission is detected at VLSR = +9.24 km s-1, with an almost Gaussian shape. In addition, weak absorption may be present near VLSR = +2...+4 km s-1, which appears in both polarizations. If confirmed, this absorption arise in the Orion Ridge (Tauber et al. 1994). Standing waves prohibit the detection of continuum signal in our data down to an rms of ≈ 1 K in  .
.
Line parameters.
Table 1 lists the parameters of the emission feature, measured by fitting a Gaussian profile to the data in Fig. 1. The measured VLSR agrees well with values for the dense molecular gas in the Orion Bar as probed by H2CO and CH3OH lines in the 100–400 GHz range (Hogerheijde et al. 1995; Leurini et al. 2006). However, the FWHM line width of 4.86 km s-1 is much broader than measured for the dense molecular gas, by a factor of ≳ 2. This difference is about twice as large as expected from the lower mass of the HF molecule compared with species such as CO. The width of the HF line is close to the values measured for C+ and CH+ (Nagy et al., in prep.), suggesting an origin of the observed HF emission in the low-density interclump gas of the Orion Bar, which is a surprise given the large critical density (~5 × 109 cm-3) of the line.
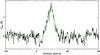 |
Fig. 1 Spectrum of the HF J = 1–0 line, observed with Herschel-HIFI toward the Orion Bar. |
4. Excitation by H2
To clarify the origin of the observed HF emission, we have performed model calculations with the RADEX program (Van der Tak et al. 2007). This program solves the equations of statistical equilibrium in the presence of collisional and radiative excitation, treating optical depth effects in the lines with an escape probability formalism. The calculations use spectroscopic input data from the JPL catalog (Pickett et al. 1998), and collisional rate coefficients for the HF-H2 system from Guillon & Stoecklin (2012). These collision rates are ≈ 10 times larger than calculated for the HF-He system (Reese et al. 2005), even after scaling for the difference in reduced mass (Schöier et al. 2005). This difference is at the upper end of the expected range (Van der Tak 2011), due to the large well depth of the HF-H2 interaction potential. All calculations assume a line width of 5 km s-1 (Table 1) and a background radiation field of 2.73 K due to the cosmic microwave background. We assume that the ortho-para ratio of H2 equals its thermal value. The free parameters in the calculation are the kinetic temperature, the gas density n(H2) and the HF column density N(HF).
Based on the measured line width, we first consider an origin of the HF emission in the warm interclump gas close to the ionization front. We adopt n(H2) = 105 cm-3, N(H2) = 1022 cm-2 (Hogerheijde et al. 1995), and assume that all fluorine (at Solar abundance) is in the form of HF, as is commonly observed for diffuse interstellar clouds. This assumption implies an HF abundance of 3.6 × 10⁻⁸, so that N(HF) = 3.6 × 1014 cm-2. For a gas kinetic temperature of 100 K, this model predicts an intensity for the HF 1–0 line of 0.5 K, which is a factor of 3 lower than observed. Models in which the HF emission arises in warm surface layers with a low molecular fraction and accordingly a low HF abundance also do not match our observations, provided that HF-H collision rates are similar to those for HF-H2. We conclude that the observed HF emission does not originate in the warm interclump gas if collisional excitation by H2 or H is responsible.
As an alternative model, we consider an origin of the HF emission in the dense clumps of the Orion Bar. For this gas, we assume a kinetic temperature of 85 K (Hogerheijde et al. 1995), N(H2) ≈ 1 × 10²³ (e.g., Van der Wiel et al. 2009) and an HF abundance of ≲ 3.6 × 10⁻⁸. These models reproduce the observed HF line intensity for gas densities in the range 108–109 cm-3 and N(HF) in the range 1012–1013 cm-2.The line optical depth in these models is around unity, which is consistent with the observed line shape. The implied HF abundance is ~10-10–10-11, which is similar to the values found for dense gas in previous studies (Phillips et al. 2010). Since the line is effectively optically thin, lower H2 volume densities require correspondingly higher HF column densities, so that the elemental fluorine abundance would be exceeded. We conclude that thermal excitation of the HF line indicates a high gas density of n = 108–109 cm-3, similar to the inner envelopes of late-type stars where HF emission is also seen (Agúndez et al. 2011).
One problem with this alternative model is that the required gas density of ~109 cm-3 is much higher than commonly adopted for the Orion Bar. An origin of the HF emission in high-density clumps is also inconsistent with the line width, which is much larger than that of CO. In addition, while peak densities of ~109 cm-3 may occur locally, this value is unreasonably high as an average over the 7200 AU HIFI beam. Finally, the Orion Bar does not stand out for its high density between regions where HF has been observed, which all show the line in absorption.
5. Excitation by electrons
Although collisional excitation of HF by H2 does not match our observations of the Orion Bar, H2 is not the only possible collision partner responsible for the excitation of HF in PDR-type regions. In the interclump gas of the Orion Bar, most carbon is in the form of C+, leading to an electron abundance of ~10-4 and an electron density of 10 cm-3. Under these conditions, a model without collisional excitation by electrons would be incomplete. Quantum mechanical calculations of collisional cross sections for the e-HF system only exist for T > 500 K (Thümmel et al. 1992), but for highly polar molecules such as HF, the Born approximation (see, e.g., Itikawa & Mason 2005) should give reliable results as long as kT > Eup. We have calculated electron impact excitation rates for the ΔJ = 1 transitions of HF in the Born approximation, and scaled the values to the results of the R-matrix calculations by Thümmel et al. (1992). These rates should be accurate to within a factor of ≈ 2, similar to the well-studied e-H2O system with a similar dipole moment (Zhang et al. 2009), and sufficient for our purposes. Calculations with RADEX indicate that for T = 100 K and ne = 10 cm-3, the observed HF line intensity is reproduced for N(HF) ≈ 1 × 1015 cm-2.
The corresponding H2 column density may be estimated from the C+ observations by Herrmann et al. (1997) with the KAO in a 55′′ beam. These data indicate that N(C+) ≈ (3–5) × 1018 cm-2, so that for C+/H2 = 2 × C/H = 2.4 × 10⁻⁴ (Wakelam & Herbst 2008; Sofia et al. 2011), we obtain N(H2) = (1.3–2.0) × 1022 cm-2. This value is a lower limit because of beam dilution: mapping of C+ with HIFI indicates that N(C+) and therefore N(H2) is ~3–5 times higher (Röllig et al., in prep.). The HF abundance in the C+–H2 layer is thus (3–4) × 10-8, consistent with the Solar fluorine abundance. We conclude that electron excitation in the interclump medium is a viable model to explain the observed HF emission in the Orion Bar.
6. Conclusions
We have presented observations of the HF J = 1–0 line toward the Orion Bar, which is the first time that this line is seen in emission from the Galactic interstellar medium. We present calculations and arguments why this emission cannot be caused by collisional excitation of HF by H2, either from dense clumps or from the inter-clump medium. However, collisional excitation by electrons in the interclump gas explains our observations. The appearance of HF in emission therefore seems to be a signpost of molecular gas with a high electron density, which in the case of the Orion Bar is the combined effect of the high gas density and the strong ultraviolet radiation field.
The physical conditions of the Orion Bar may be similar to those in the nucleus of the active galaxy Mrk 231, where the radiation field is strong and where the HF line also appears in emission (Van der Werf et al. 2010). Other active galactic nuclei where HF appears in absorption such as Arp 220 (Rangwala et al. 2011) and the Cloverleaf (Monje et al. 2011b) probably have lower electron densities, which may indicate a softer radiation field.
Support for an origin of the HF emission in the interclump medium comes from the detection of CF+ toward the Orion Bar (Neufeld et al. 2006). Additional support for this model would come from observations of H2F+, for which line frequencies are known (Fujimori et al. 2011). However, our data do not show any features at the predicted line frequencies down to an rms of ≈ 50 mK in , which is a factor of ~10 above the expected signal.
In the future, maps of HF emission with Herschel-HIFI will help to clarify the spatial distribution of dense gas clumps in the Orion Bar and other PDRs. Another useful test would be the observation of HF J = 2–1 or higher-J lines in the v = 0 or v = 1 states. Unfortunately, the J = 2–1 line at 2463 GHz lies very close (0.13 μm) to the N+3P1–3P0 fine-structure line at 205.5 μm, so that the lines are blended at the resolution of the PACS instrument onboard Herschel. Heterodyne observations in this frequency range may become possible with the future STO telescope, the SOFIA airborne observatory, or the Millimetron mission.
Acknowledgments
The authors thank Frank Helmich for useful discussions, Grégoire Guillon and Thierry Stoecklin for sending their HF-H2 collision data ahead of publication, Yunhee Choi for help with the data reduction, and John Black and David Neufeld for comments on the manuscript. Part of this work was supported by the Deutsche Forschungsgemeinschaft through grant SFB 956C. HIFI has been designed and built by a consortium of institutes and university departments from across Europe, Canada and the US under the leadership of SRON Netherlands Institute for Space Research, Groningen, The Netherlands with major contributions from Germany, France and the US. Consortium members are: Canada: CSA, U. Waterloo; France: CESR, LAB, LERMA, IRAM; Germany: KOSMA, MPIfR, MPS; Ireland, NUI Maynooth; Italy: ASI, IFSI-INAF, Arcetri-INAF; The Netherlands: SRON, TUD; Poland: CAMK, CBK; Spain: Observatorio Astronómico Nacional (IGN), Centro de Astrobiología (CSIC-INTA); Sweden: Chalmers University of Technology – MC2, RSS & GARD, Onsala Space Observatory, Swedish National Space Board, Stockholm University – Stockholm Observatory; Switzerland: ETH Zürich, FHNW; USA: Caltech, JPL, NHSC.
References
- Agúndez, M., Cernicharo, J., Waters, L. B. F. M., et al. 2011, A&A, 533, L6 [NASA ADS] [CrossRef] [EDP Sciences] [Google Scholar]
- Bergin, E. A., Phillips, T. G., Comito, C., et al. 2010, A&A, 521, L20 [NASA ADS] [CrossRef] [EDP Sciences] [Google Scholar]
- De Graauw, T., Helmich, F. P., Phillips, T. G., et al. 2010, A&A, 518, L6 [Google Scholar]
- Fujimori, R., Kawaguchi, K., & Amano, T. 2011, ApJ, 729, L2 [NASA ADS] [CrossRef] [Google Scholar]
- Guillon, G., & Stoecklin, T. 2012, MNRAS, in press [Google Scholar]
- Herrmann, F., Madden, S. C., Nikola, T., et al. 1997, ApJ, 481, 343 [NASA ADS] [CrossRef] [Google Scholar]
- Hogerheijde, M. R., Jansen, D. J., & van Dishoeck, E. F. 1995, A&A, 294, 792 [NASA ADS] [Google Scholar]
- Hollenbach, D. J., & Tielens, A. G. G. M. 1999, Rev. Mod. Phys., 71, 173 [Google Scholar]
- Itikawa, Y., & Mason, N. 2005, Phys. Rep., 414, 1 [NASA ADS] [CrossRef] [Google Scholar]
- Kaufman, M. J., Wolfire, M. G., Hollenbach, D. J., & Luhman, M. L. 1999, ApJ, 527, 795 [NASA ADS] [CrossRef] [Google Scholar]
- Leurini, S., Rolffs, R., Thorwirth, S., et al. 2006, A&A, 454, L47 [NASA ADS] [CrossRef] [EDP Sciences] [Google Scholar]
- Lis, D. C., & Schilke, P. 2003, ApJ, 597, L145 [NASA ADS] [CrossRef] [Google Scholar]
- Menten, K. M., Reid, M. J., Forbrich, J., & Brunthaler, A. 2007, A&A, 474, 515 [NASA ADS] [CrossRef] [EDP Sciences] [Google Scholar]
- Monje, R. R., Emprechtinger, M., Phillips, T. G., et al. 2011a, ApJ, 734, L23 [NASA ADS] [CrossRef] [Google Scholar]
- Monje, R. R., Phillips, T. G., Peng, R., et al. 2011b, ApJ, 742, L21 [NASA ADS] [CrossRef] [Google Scholar]
- Neufeld, D. A., & Wolfire, M. G. 2009, ApJ, 706, 1594 [NASA ADS] [CrossRef] [Google Scholar]
- Neufeld, D. A., Schilke, P., Menten, K. M., et al. 2006, A&A, 454, L37 [NASA ADS] [CrossRef] [EDP Sciences] [Google Scholar]
- Neufeld, D. A., Sonnentrucker, P., Phillips, T. G., et al. 2010, A&A, 518, L108 [NASA ADS] [CrossRef] [EDP Sciences] [Google Scholar]
- Phillips, T. G., Bergin, E. A., Lis, D. C., et al. 2010, A&A, 518, L109 [NASA ADS] [CrossRef] [EDP Sciences] [Google Scholar]
- Pickett, H. M., Poynter, R. L., Cohen, E. A., et al. 1998, J. Quant. Spec. Radiat. Transf., 60, 883 [Google Scholar]
- Pilbratt, G. L., Riedinger, J. R., Passvogel, T., et al. 2010, A&A, 518, L1 [CrossRef] [EDP Sciences] [Google Scholar]
- Rangwala, N., Maloney, P. R., Glenn, J., et al. 2011, ApJ, 743, 94 [NASA ADS] [CrossRef] [Google Scholar]
- Reese, C., Stoecklin, T., Voronin, A., & Rayez, J. C. 2005, A&A, 430, 1139 [NASA ADS] [CrossRef] [EDP Sciences] [Google Scholar]
- Roelfsema, P., Helmich, F., Teyssier, D., et al. 2012, A&A, 537, A17 [NASA ADS] [CrossRef] [EDP Sciences] [Google Scholar]
- Schöier, F. L., van der Tak, F. F. S., van Dishoeck, E. F., & Black, J. H. 2005, A&A, 432, 369 [NASA ADS] [CrossRef] [EDP Sciences] [Google Scholar]
- Simon, R., Stutzki, J., Sternberg, A., & Winnewisser, G. 1997, A&A, 327, L9 [NASA ADS] [Google Scholar]
- Sofia, U. J., Parvathi, V. S., Babu, B. R. S., & Murthy, J. 2011, AJ, 141, 22 [NASA ADS] [CrossRef] [EDP Sciences] [Google Scholar]
- Sonnentrucker, P., Neufeld, D. A., Phillips, T. G., et al. 2010, A&A, 521, L12 [NASA ADS] [CrossRef] [EDP Sciences] [Google Scholar]
- Störzer, H., Stutzki, J., & Sternberg, A. 1995, A&A, 296, L9 [NASA ADS] [Google Scholar]
- Stutzki, J., Stacey, G. J., Genzel, R., et al. 1988, ApJ, 332, 379 [NASA ADS] [CrossRef] [Google Scholar]
- Tauber, J. A., Tielens, A. G. G. M., Meixner, M., & Foldsmith, P. F. 1994, ApJ, 422, 136 [NASA ADS] [CrossRef] [Google Scholar]
- Thümmel, H. T., Nesbet, R. K., & Peyerimhoff, S. D. 1992, J. Phys. B Atom. Mol. Phys., 25, 4553 [Google Scholar]
- Van der Tak, F. F. S. 2011, in IAU Symp., 280 [arXiv:1107.3368] [Google Scholar]
- Van der Tak, F. F. S., Black, J. H., Schöier, F. L., Jansen, D. J., & van Dishoeck, E. F. 2007, A&A, 468, 627 [NASA ADS] [CrossRef] [EDP Sciences] [Google Scholar]
- Van der Werf, P. P., Isaak, K. G., Meijerink, R., et al. 2010, A&A, 518, L42 [NASA ADS] [CrossRef] [EDP Sciences] [Google Scholar]
- Van der Wiel, M. H. D., van der Tak, F. F. S., Ossenkopf, V., et al. 2009, A&A, 498, 161 [NASA ADS] [CrossRef] [EDP Sciences] [Google Scholar]
- Wakelam, V., & Herbst, E. 2008, ApJ, 680, 371 [NASA ADS] [CrossRef] [Google Scholar]
- Walmsley, C. M., Natta, A., Oliva, E., & Testi, L. 2000, A&A, 364, 301 [NASA ADS] [Google Scholar]
- Wang, Y., Jaffe, D. T., Evans, II, N. J., et al. 1993, ApJ, 419, 707 [NASA ADS] [CrossRef] [Google Scholar]
- Young Owl, R. C., Meixner, M. M., Wolfire, M., Tielens, A. G. G. M., & Tauber, J. 2000, ApJ, 540, 886 [NASA ADS] [CrossRef] [Google Scholar]
- Zhang, R., Faure, A., & Tennyson, J. 2009, Phys. Scr., 80, 015301 [NASA ADS] [CrossRef] [Google Scholar]
All Tables
All Figures
|
Fig. 1 Spectrum of the HF J = 1–0 line, observed with Herschel-HIFI toward the Orion Bar. |
| In the text | |
Current usage metrics show cumulative count of Article Views (full-text article views including HTML views, PDF and ePub downloads, according to the available data) and Abstracts Views on Vision4Press platform.
Data correspond to usage on the plateform after 2015. The current usage metrics is available 48-96 hours after online publication and is updated daily on week days.
Initial download of the metrics may take a while.