| Issue |
A&A
Volume 537, January 2012
|
|
|---|---|---|
| Article Number | A74 | |
| Number of page(s) | 5 | |
| Section | Atomic, molecular, and nuclear data | |
| DOI | https://doi.org/10.1051/0004-6361/201118205 | |
| Published online | 11 January 2012 | |
Oscillator strengths for lines of astrophysical interest in Rh II⋆
1 Astrophysique et Spectroscopie, Université de Mons – UMONS, 7000 Mons, Belgium
e-mail: This email address is being protected from spambots. You need JavaScript enabled to view it.
2 IPNAS, Université de Liège, Sart Tilman, 4000 Liège, Belgium
3 Department of Physics, Lund University, PO Box 118, 221 00 Lund, Sweden
4 Lund Observatory, Lund University, PO Box 43, 221 00 Lund, Sweden
Received: 4 October 2011
Accepted: 24 October 2011
Abstract
Aims. This work reports oscillator strengths for transitions of astrophysical interest in singly ionized rhodium.
Methods. Seventeen radiative lifetimes in Rh+ have been measured with the time-resolved laser-induced fluorescence technique and combined with theoretical branching fractions calculated using a relativistic Hartree-Fock model including core-polarization effects to obtain oscillator strengths.
Results. On the basis of the good agreement between theory and experiment for the lifetimes, new reliable oscillator strengths have been deduced for a set of 113 Rh II transitions in the spectral range 153–418 nm.
Key words: atomic processes / atomic data
Table 3 is also available at the CDS via anonymous ftp to cdsarc.u-strasbg.fr (130.79.128.5) or via http://cdsarc.u-strasbg.fr/viz-bin/qcat?J/A+A/537/A74
© ESO, 2012
1. Introduction
The investigation of high resolution astronomical spectra depends directly on reliable atomic data such as transition probabilities and oscillator strengths. Although many data are now available from modern experimental techniques or sophisticated theoretical methods, they are still insufficient to meet all the needs of astrophysicists. This is particularly true for singly ionized rhodium for which no radiative data have been published so far in the literature despite the fact that several Rh II lines have been identified in different astrophysical spectra such as the solar spectrum (Moore et al. 1966) and the spectra of the HgMn type star χLupi (Lundberg et al. 1998), the super-rich mercury star HD 65949, the HgMn star HD 175640 and the peculiar Przybylski’s star HD 101065 (Cowley 2009). As examples, for the three latter stars, lines observed at λ = 309.35, 316.22, 318.79, 320.73, 324.05, 330.74 and 347.78 nm were identified as radiative transitions in Rh II.
Rhodium has one stable isotope, 103Rh, and 19 short-lived isotopes and isomers. In stellar nucleosynthesis, it is produced by both the r- and s-processes. The spectrum of singly ionized rhodium belongs to the Ru I isoelectronic sequence with 4d83F4 as the ground state. The laboratory term analysis was performed by Sancho (1958) who classified 814 spectral lines extending from 118.7 to 328.8 nm and established a list of 36 even and 84 odd energy levels belonging to the 4d8, 4d75s and 4d75p configurations. This work was taken as reference in subsequent atomic data compilations by Moore (1971), Meggers et al. (1975) and Reader et al. (1980). To our knowledge, the only determination of experimental transition probabilities in Rh II is due to Corliss & Bozman (1962) but their arc measurements have been recognized to be affected by large systematic errors.
In the present paper, we report on time-resolved laser-induced fluorescence (TR-LIF) lifetime measurements for 17 levels in Rh II. These new experimental lifetimes have been used to assess the reliability of theoretical results obtained within the framework of the relativistic Hartree-Fock (HFR) approach (Cowan 1981) modified by the inclusion of core-polarization effects (HFR+CPOL) (Quinet et al. 1999). From the combination of experimental lifetimes and theoretical branching fractions, it has been possible to obtain a new set of semi-empirical oscillator strengths for selected transitions of astrophysical interest. This work is an extension to longer wavelengths of our recent paper focused on VUV lines in singly ionized rhodium (Quinet et al. 2011).
2. Radiative lifetime measurements
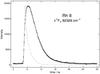 |
Fig. 1 Decay of the 4d7(4F)5p z3F |

The experimental setup used in the present experiments has been described elsewhere (Bergström et al. 1988; Xu et al. 2004; Nilsson et al. 2010) and only a brief description will be given here. The lifetime measurements were performed on ions in a laser-generated plasma employing the time-resolved laser-induced-fluorescence technique. Nd-YAG laser pulses at 532 nm with a duration of 10 ns were focused onto the surface of a rotating rhodium target in a vacuum chamber with a background pressure of about 10-5 mbar. For the excitation of the investigated levels, the expanding rhodium plasma was crossed at right angle by a pulsed laser beam tuned to a resonant transition of the upper level of interest. The laser used a DCM dye and was pumped by a second Nd:YAG laser. The pump laser pulses had a duration of 10 ns and were compressed to about 1.5 ns utilizing stimultated Brillouin scattering in a water cell. The two Nd:YAG lasers were synchronized by a pulse generator and had a repetition rate of 10 Hz. For the selective excitation of the investigated Rh+ levels the corresponding wavelengths were achieved using the third harmonic of the red dye laser light, obtained by harmonic generation in KDP and BBO crystals and, if necessary, shifted by stimulated Raman scattering in hydrogen gas. In the measurements metastable levels of the same parity as the ground level were used as starting point for the selective excitation. These levels, with energies between 16 885 and 20 647 cm-1, are only populated in an early stage of the plasma expansion. The measurements were performed about 5 mm above the target and the delay between the plasma-generating and excitation pulses was around 300 ns. This corresponds to an ion velocity larger than 104 m/s in the expanding plasma.
Experimental and calculated lifetimes obtained in the present work for selected levels within the 4d7(4F)5p configuration of Rh II.
The TR-LIF signal was selected by a 1/8 m monochromator, detected by a fast photomultiplier tube with rise time 0.15 ns and digitized by an oscilloscope with 2.5 GHz analogue bandwidth. The temporal shape of the exciting laser pulses was recorded simultaneously using a photo diode. Each pair of curves were formed by averaging over 1000 laser pulses and then transferred to a PC for further treatment. The lifetimes were obtained after fitting the LIF curve with an exponential convoluted with the recorded laser pulse. An example of an experimental recording is shown in Fig. 1. In Table 1 the lifetime values are given together with the lower level used for the selective excitation, excitation wavelength, non-linear processes to obtain this wavelength from a red dye laser and strongest detection channel. Whenever possible recordings were made on several detection wavelengths. The lifetime values are averages of more than 10 recordings performed at at least two different occasions. The uncertainties in the table are mainly due to variation in results between repeated measurements and possible systematic errors, which were carefully checked for (Sikström et al. 2002). They correspond to at least a 95% confidence interval of the various measurements. Due to recombination in the plasma LIF curves for all investigated states were more or less affected by background light. The problem could not be avoided since the metastable platform levels were only populated during the early stage of the plasma evolution. The background was subtracted in the fitting procedure but remains as a major contribution to the error bars in the present measurements.
3. Transition probability and oscillator strength calculations
As the Rh+ ion belongs to the ruthenium isoelectronic sequence, we considered a relativistic Hartree-Fock model with core-polarization (HFR+CPOL) similar to the one used with success in Ru I (Fivet et al. 2009). More precisely, the configurations included in the configuration interaction expansions were the following: 4d8 + 4d75s + 4d76s + 4d75d + 4d76d + 4d65s2 + 4d65p2 + 4d65d2 + 4d65s6s + 4d65s5d + 4d65s6d (even parity) and 4d75p + 4d76p + 4d74f + 4d75f + 4d65s5p + 4d65s6p + 4d65p5d + 4d65p6s (odd parity). The ionic core considered for the core-polarization model potential and the correction to the dipole operator was a Mo-like core, i.e. a 4d6 Rh IV core. The dipole polarizability, αd, for such a core is, according to Fraga et al. (1976), equal to 4.79 a . For the cut-off radius, rc, we used the HFR mean value ⟨ r ⟩ of the outermost 4d core orbital, i.e. 1.52 a0.
Some radial integrals, considered as free parameters, were then adjusted with a least-squares optimization program minimizing the discrepancies between the calculated Hamiltonian eigenvalues and the experimental energy levels from Sancho (1958). More precisely, for the 4d8, 4d75s and 4d75p configurations, the average energies (Eav), the electrostatic direct (Fk) and exchange (Gk) integrals, the spin-orbit (ζnl) and the effective interaction (α) parameters were allowed to vary during the fitting process. An additional effective operator (β) for the 4d75s configuration was also included in the adjustment. All other Slater integrals were scaled down by a factor 0.85 following a well-established procedure (Cowan 1981). The designations of the even levels at 8164.4 and 11 643.7 cm-1 in Sancho (1958) were interchanged as indicated by the calculations of Shadmi (1961). The even level at 35012.0 cm-1 was excluded from the fit because its designation as 4d7(2P)5s b3P0 by Sancho (1958) appeared questionable. In fact the predicted eigenvalue for this state was found to be more than 1000 cm-1 above the experimental value. Actually, the closest even eigenstate with J = 0 is 4d81S0. Unfortunately, a comparison between the predicted transition probabilities and the intensities observed by Sancho (1958) for the 6 classified lines (of which 2 are doubly classified) involving this level was not conclusive in asserting this alternative designation. The standard deviations of the fits were 50 cm-1 for the even parity (35 levels, 12 parameters) and 111 cm-1 for the odd parity (84 levels, 9 parameters). The adopted radial parameter values with their standard deviations are given in Table 2.
Theoretical radiative lifetimes obtained in the present study are compared with the experimental values in Table 1. As shown in this table, the agreement between theory and experiment is good. However, the HFR+CPOL lifetimes are systematically about 10% longer than the measurements. This is probably due to the fact that core-polarization effects were slightly overestimated in our physical model. It is worth mentioning that calculated lifetimes were found to decrease by up to 5% when using a dipole polarizability equal to 4.3  , i.e. 10% smaller than the one published by Fraga et al. (1976) for Rh IV. It was also verified that a variation of 10% of the cut-off radius did not modify the computed lifetimes.
Adopted radial parameters for the 4d8, 4d75s and 4d75p configurations.
Considering the experimental lifetime values and the theoretical branching fractions as obtained in the present work, it is possible to derive normalized transition probabilities and oscillator strengths. In Table 3, we present the gA- and log gf-values for the strongest lines (log gf > −2.0) depopulating the levels for which the experimental lifetimes are reported in Table 1.
4. Conclusions
A new set of transition probabilities and oscillator strengths has been obtained for transitions depopulating 17 levels of Rh II belonging to the 4d7(4F)5p configuration. These results have been obtained from a combination of experimental lifetimes measured by laser-induced fluorescence spectroscopy and HFR+CPOL branching fractions.
Transition probabilities and oscillator strengths for Rh II selected lines. X(Y) stands for X × 10Y. Only transitions with log gf ≥ − 2.0 are listed in the table.
Acknowledgments
This work was financially supported by the Integrated Initiative of Infrastructure Project LASERLAB-EUROPE, contract RII3-CT-2003-506350, the Swedish Research Council through the Linnaeus grant and grant 2006-3085, the Knut and Alice Wallenberg Foundation and the Belgian FRS-FNRS. E.B., P.Q. and P.P. are, respectively, Research Director, Senior Research Associate and Research Associate of the FRS-FNRS. They are grateful to the Swedish team for the warm hospitality enjoyed at the Lund Laser Centre during the measurements.
References
- Bergström, H., Faris, H., Hallstadius, G. W., et al. 1988, Z. Phys. D, 8, 17 [Google Scholar]
- Biémont, E., Palmeri, P., Quinet, P., et al. 2001, MNRAS, 328, 1085 [NASA ADS] [CrossRef] [Google Scholar]
- Corliss, C. H., & Bozman, W. R. 1962, in Nat. Bur. Stand. Monogr. (Washington DC: US Department of Commerce), 53 [Google Scholar]
- Cowan, R. D. 1981, The Theory of Atomic Structure and Spectra (Berkeley: California University Press) [Google Scholar]
- Cowley, C. R. 2009, http://www.astro.lsa.umich.edu~/cowley [Google Scholar]
- Fivet, V., Quinet, P., Palmeri, P., et al. 2009, MNRAS, 396, 2124 [NASA ADS] [CrossRef] [Google Scholar]
- Fraga, S., Karwowski, J., & Saxena, K. M. S. 1976, Handbook of Atomic Data (Amsterdam: Elsevier) [Google Scholar]
- Lundberg, H., Johansson, S., Litzén, U., Wahlgren, G. M., & Leckrone, S. 1998, in The Scientific Impact of the Goddard High Resolution Spectrograph, ASP Conf. Ser., 143, 343 [NASA ADS] [Google Scholar]
- Meggers, W. F., Corliss, C. H., & Scribner, B. F. 1975, Nat. Bur. Stand. NBS, Monograph (Washington DC: US Department of Commerce), 145 [Google Scholar]
- Moore, C. E. 1971, Nat. Stand. Ref. Data Ser. NSRDS-NBS, 35, III [Google Scholar]
- Moore, C. E., Minnaert, M. G. J., & Houtgast, J. 1966, The Solar Spectrum 2935 Å to 8770 Å, NBS Monograph 61 (Washington DC: US Department of Commerce) [Google Scholar]
- Nilsson, H., Hartman, H., Engström, L., et al. 2010, A&A, 511, A16 [NASA ADS] [CrossRef] [EDP Sciences] [Google Scholar]
- Quinet, P., Palmeri, P., Biémont, E., et al. 1999, MNRAS, 307, 934 [NASA ADS] [CrossRef] [EDP Sciences] [Google Scholar]
- Quinet, P., Biémont, E., Palmeri, P., et al. 2011, J. Elec. Spectr. Rel. Phen., 184, 174 [Google Scholar]
- Reader, J., Corliss, C. H., Wiese, W. L., & Martin, G. A. 1980, Nat. Stand. Ref. Data Ser. NSRDS-NBS, 68 [Google Scholar]
- Sancho, F. J. 1958, Anales Real. Soc. Esp. Fis. Quim., 54A, 41 [Google Scholar]
- Shadmi, Y. 1961, Bull. Res. Council Israel, 9F, 141 [Google Scholar]
- Sikström, C. M., Nilsson, H., Litzén, U., Blom, A., & Lundberg, H. 2002, J. Quant. Spec. Radiat. Transf., 74, 355 [Google Scholar]
- Xu, H. L., Persson, A., Svanberg, S., et al. 2004, Phys. Rev. A, 70, 042508 [NASA ADS] [CrossRef] [Google Scholar]
- Zhang, Z. G., Li, Z. S., Svanberg, S., et al. 2001, Eur. Phys. J. D, 15, 301 [NASA ADS] [CrossRef] [EDP Sciences] [Google Scholar]
All Tables
Experimental and calculated lifetimes obtained in the present work for selected levels within the 4d7(4F)5p configuration of Rh II.
Transition probabilities and oscillator strengths for Rh II selected lines. X(Y) stands for X × 10Y. Only transitions with log gf ≥ − 2.0 are listed in the table.
All Figures
|
Fig. 1 Decay of the 4d7(4F)5p z3F |
| In the text | |
Current usage metrics show cumulative count of Article Views (full-text article views including HTML views, PDF and ePub downloads, according to the available data) and Abstracts Views on Vision4Press platform.
Data correspond to usage on the plateform after 2015. The current usage metrics is available 48-96 hours after online publication and is updated daily on week days.
Initial download of the metrics may take a while.