Free Access
Fig. 9
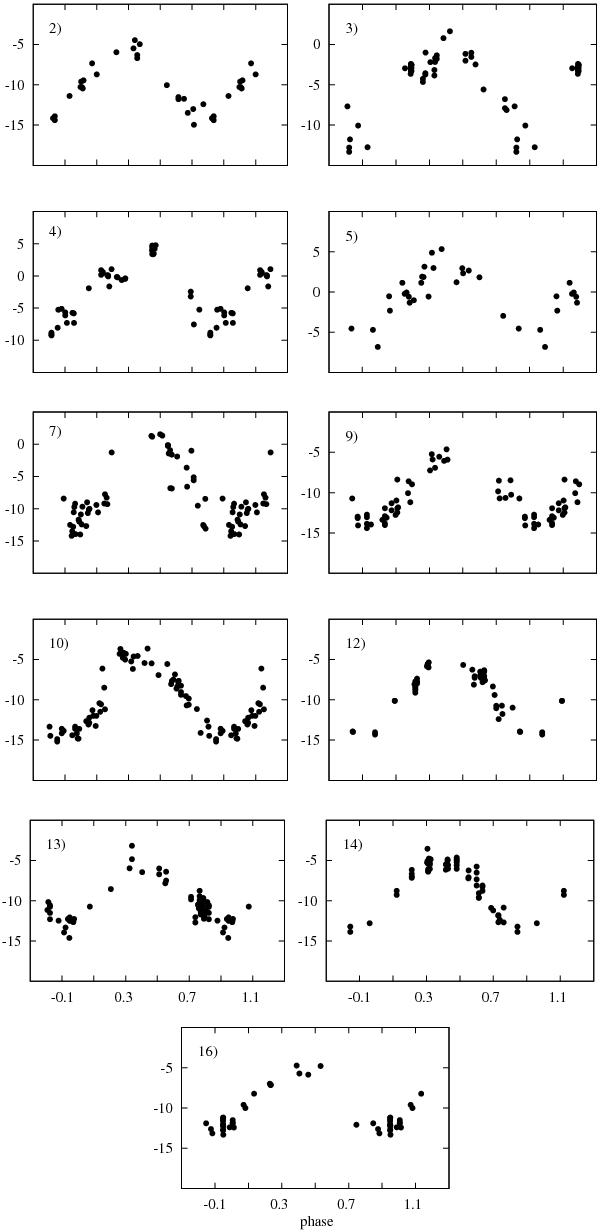
Phase diagrams for subsets of Hα emission-wing RVs measured manually. The ordinates of all plots are RVs in km s-1 and the individual subsets vertical axis is in RV and the different ranges reflect the fact that the original, not prewhitened RVs are used. Trial orbital solutions for these subsets are in Tables 5 and 6.
This figure is made of several images, please see below:
Current usage metrics show cumulative count of Article Views (full-text article views including HTML views, PDF and ePub downloads, according to the available data) and Abstracts Views on Vision4Press platform.
Data correspond to usage on the plateform after 2015. The current usage metrics is available 48-96 hours after online publication and is updated daily on week days.
Initial download of the metrics may take a while.