| Issue |
A&A
Volume 537, January 2012
|
|
|---|---|---|
| Article Number | A54 | |
| Number of page(s) | 7 | |
| Section | Planets and planetary systems | |
| DOI | https://doi.org/10.1051/0004-6361/201117916 | |
| Published online | 09 January 2012 | |
Transiting exoplanets from the CoRoT space mission ⋆
XIX. CoRoT-23b: a dense hot Jupiter on an eccentric orbit
1
LESIA, UMR 8109 CNRS, Observatoire de Paris, UVSQ, Université
Paris-Diderot,
5 place J. Janssen,
92195
Meudon,
France
e-mail: This email address is being protected from spambots. You need JavaScript enabled to view it.
2
Instituto de Astrofisica de Canarias, 38205, La Laguna, Tenerife, Spain
3
Institute of Planetary Research, German Aerospace Center, Rutherfordstrasse 2,
12489
Berlin,
Germany
4
Laboratoire d’Astrophysique de Marseille,
38 rue Frédéric Joliot-Curie,
13388
Marseille Cedex 13,
France
5
Research and Scientic Support Department, ESTEC/ESA,
PO Box 299,
2200 AG
Noordwijk, The
Netherlands
6
School of Physics and Astronomy, Raymond and Beverly Sackler
Faculty of Exact Sciences, Tel Aviv University, Tel Aviv, Israel
7
Observatoire de la Côte d’Azur, Laboratoire
Cassiopée, BP
4229, 06304
Nice Cedex 4,
France
8
Department of Physics, Denys Wilkinson Building Keble Road,
Oxford, OX1 3RH, UK
9
Institut d’Astrophysique Spatiale, Université Paris
XI, 91405
Orsay,
France
10
Observatoire de Haute Provence, 04670 Saint Michel l’Observatoire,
France
11
Institut d’Astrophysique de Paris, 98bis boulevard Arago, 75014
Paris,
France
12
University of Vienna, Institute of Astronomy,
Türkenschanzstr. 17,
1180
Vienna,
Austria
13 IAG, Universidade de Sao Paulo, Brazil
14
Thüringer Landessternwarte, Sternwarte 5, Tautenburg
5, 07778
Tautenburg,
Germany
15
Observatoire de l’Université de Genève,
51 chemin des Maillettes,
1290
Sauverny,
Switzerland
16
LUTH, Observatoire de Paris, CNRS, Université Paris
Diderot, 5 place Jules
Janssen, 92195
Meudon,
France
17 Rheinisches Institut für Umweltforschung an der Universität
zu Köln, Aachener Strasse 209, 50931, Germany
18 University of Liège, Allée du 6 août 17, Sart Tilman, Liège
1, Belgium
19
Space Research Institute, Austrian Academy of
Science, Schmiedlstr.
6, 8042
Graz,
Austria
20
Universidad de La Laguna, Dept. de Astrofísica, 38200
La Laguna, Tenerife,
Spain
Received: 19 August 2011
Accepted: 3 October 2011
Abstract
We report the detection of CoRoT-23b, a hot Jupiter transiting in front of its host star with a period of 3.6314 ± 0.0001 days. This planet was discovered thanks to photometric data secured with the CoRoT satellite, combined with spectroscopic radial velocity (RV) measurements. A photometric search for possible background eclipsing binaries conducted at CFHT and OGS concluded with a very low risk of false positives. The usual techniques of combining RV and transit data simultaneously were used to derive stellar and planetary parameters. The planet has a mass of Mp = 2.8 ± 0.3 MJup, a radius of Rpl= 1.05 ± 0.13RJup, a density of ≈ 3 g cm-3. RV data also clearly reveal a nonzero eccentricity of e = 0.16 ± 0.02. The planet orbits a mature G0 main sequence star of V = 15.5 mag, with a mass M⋆ = 1.14 ± 0.08 M⊙, a radius R ⋆ = 1. 61 ± 0.18 R⊙ and quasi-solarabundances. The age of the system is evaluated to be 7 Gyr, not far from the transition to subgiant, in agreement with the rather large stellar radius. The two features of a significant eccentricity of the orbit and of a fairly high density are fairly uncommon for a hot Jupiter. The high density is, however, consistent with a model of contraction of a planet at this mass, given the age of the system. On the other hand, at such an age, circularization is expected to be completed. In fact, we show that for this planetary mass and orbital distance, any initial eccentricity should not totally vanish after 7 Gyr, as long as the tidal quality factor Qp is more than a few 105, a value that is the lower bound of the usually expected range. Even if CoRoT-23b features a density and an eccentricity that are atypical of a hot Jupiter, it is thus not an enigmatic object.
Key words: techniques: spectroscopic / techniques: photometric / stars: fundamental parameters / planetary systems / techniques: radial velocities
The CoRoT space mission, launched on 27 December 2006, has been developed and is operated by CNES, with the contribution of Austria, Belgium, Brazil, ESA, Germany, and Spain. First CoRoT data are available to the public from the CoRoT archive: http://idoc-corot.ias.u-psud.fr. The complementary observations were obtained with MegaPrime/MegaCam, a joint project of CFHT and CEA/DAPNIA, at the Canada-France-Hawaii Telescope (CFHT) which is operated by NRC in Canada, INSU-CNRS in France, and the University of Hawaii; ESO Telescopes at the La Silla and Paranal Observatories under program 184.C0639; the OGS telescope operated by the Instituto de Astrofísica de Tenerife at Tenerife.
© ESO, 2012
1. Introduction
Transiting exoplanets are especially interesting in the study of exoplanet structure and evolution, since a transit allows measurement of the radius of the exoplanet and also ensures that the inclination is close to 90°, therefore that the true mass is the minimum mass derived from radial velocities (RV). Transiting planets thus provide strong constraints on planetary internal structures and evolution models by yielding mass, radius, and density. Since H209458b (Charbonneau et al. 2000), the first transiting planet, extensive ground-based photometric surveys (OGLE, TrES, XO, HAT and SuperWASP) and, more recently, space missions (MOST, CoRoT, Kepler) provide many transiting planetary candidates, and today (June 2011) 172 exoplanets have been confirmed with well constrained masses for a large majority of cases.
Since the beginning of 2007, the space mission CoRoT performs wide-field stellar photometry at ultra-high precision from space (Rouan et al. 1998; Baglin et al. 2006). Currently, during an observing run up to 6000 stars1 can be monitored simultaneously and continuously over periods of 20 to 150 days of observation. CoRoT is thus particularly well-suited to detect planets with rather short orbital periods, from less than one day to 50 days, and sometimes more (Deeg et al. 2010). CoRoT has already detected 22 planets or brown dwarves in June 2011, and in this paper, we report the discovery of a 23 rd transiting massive planet detected around the main sequence G0 star CoRoT-23.
As in all transit surveys, ground-based follow-up is mandatory for confirming a transiting planet candidate. In the case of CoRoT-23b, the one planet whose detection is claimed hereafter, a standard follow-up program was performed, including photometry, spectroscopy, and RV measurements, using different ground-based facilities over the world.
We present the photometric analysis of the CoRoT data from which we discovered this transit candidate in Sect. 2, while the photometric follow-up and results of the RV measurements that allowed its planetary nature to be secured, are depicted in in Sects. 3.1 and 3.2, respectively. The stellar parameters derived from spectroscopic analysis are presented in Sect. 3.3, while final planetary and stellar parameters are given in Sect. 4. Several questions about the eccentricity and the density of the planet, in relation with its age, are discussed in Sect. 5.
2. CoRoT observations
IDs, coordinates, and magnitudes.
The star CoRoT-23 was observed during the LRc05 long run of CoRoT (02/04/2010 to 05/07/2010) towards the Serpens Cauda constellation. Its ID is given in Table 1, based on the Exo-Dat database (Deleuil et al. 2009). Spurious spikes and stellar variations at frequencies outside the range expected for planetary transits were removed with low- and high-pass filters, as illustrated in Fig. 1. Then, different detection algorithms were used and 24 individual transits were eventually detected.
The main transit parameters, i.e., period, central date, ingress/egress duration, total duration, and relative depth, are estimated using the differential evolution global optimization method (Veras & Ford 2009). The model is parameterized by the squared star-planet radius ratio, transit center, period, inverse of the transit width (Kipping 2010), squared impact parameter, limb-darkening cofficient(s), a zeropoint correction, and the eccentricity, when provided. The MCMC simulations also include a scale factor to the point-to-point scatter estimated from the lightcurve as a free parameter (somewhat similar to the way the errors are handled by Gregory2007), so these distributions are marginalized over both the uncertain zeropoint and point-to-point scatter in order to obtain reliable results.
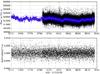 |
Fig. 1 CoRoT LC of the target CoRoT-23. The apparent change of regime at CoRoT JD 3783 corresponds to the change in the sampling period from 512 s to 32 s. Upper panel: raw data (in black), at a unique sampling period of 512 s (blue) and after a median-smoothing on 10 h (purple). Lower panel: LC after applying a detrending filter. |
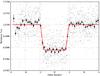 |
Fig. 2 Phase-folded LC of CoRoT-23b using the ephemeris given in Table 3 with, superimposed, a simple trapezoidal fit. |
The different analysis agree on a period of 3.6313 ± 0.0001 days. Figure 2, where all transits are summed using this period, shows the clear transit signal and its fit by a trapezoid. We evaluated τ23 = 3.383 h and τ14 = 3.888 h for the inner and outer durations, respectively and ΔF/F = 4.3 × 10⁻³ ± 10-4 for the depth of the transit. Those values take an estimate of the contamination of 7.2% by stars in the field into account, based on modeled CoRoT point spread function (PSF). A more complete analysis was performed in a second step, once the RV data analysis was able to provide an eccentricity estimate (see Sect. 3.2).
3. Ground-based observations
3.1. Photometric time series
Whenever clear periodic transit-like events are detected in a CoRoT LC and when the candidate survives the set of tests performed to rule out obvious stellar systems (Carpano et al. 2009), a ground-based follow-up program is initiated. The goal is to check further for possible contaminating eclipsing binaries (CEBs) whose PSF could fall within the CoRoT photometric mask. This is done by searching for photometric variations on nearby stars during the predicted transits.
The CoRoT exoplanet channel has a large PSF extending over a roughly ellispoidal area of 60 arcsec × 32 arcsec, which implies a significant probability that candidates detected in the CoRoT data arise from nearby CEBs. The photometric follow-up program of CoRoT candidates intends to identify such CEBs, comparing observations during predicted transit-times with observations out of transit. Time-series follow-up is described in more detail in Deeg et al. (2009).
Figure 3 shows that the field is rather crowded around the target star (labeled with a T). For any nearby star around the CoRoT-23 target, we calculated the expected eclipse amplitude if this star was the source of the observed dips. Calculation of this amplitude is based on a model of the stellar PSF, the shape of the photometric aperture, and the position and magnitudes of the target and the contaminating stars, respectively. These amplitudes were found for the stars labeled A, B, C, D, and G in Fig. 3 to be in the range of 0.2–0.9 mag, whereas all other stars are either too far away or too faint to be of concern.
Observations to identify whether any of the concerned stars show such amplitudes were then done on two telescopes: the 1m OGS on Izaa, Tenerife, and the CFHT, Hawaii. The observations on OGS were taken during a transit on 13 Aug. 2010, and the off-transit comparison on 10 Aug. 2011. The CFHT observations with MEGACAM (Boulade et al. 2003) were performed during a transit on 7 Sept. 2010 and one day after, at the same hour of the night (20 exposures of 10 s integration during 16 min). From both data sets, photometry was extracted through classical differential photometric techniques and the stars on-and off-transit brightness were compared. In no case did the concerned stars show any relevant brightness variations. The times of the transit events in Aug. resp. Sept. 2010 could be predicted with an error of about 30 min, and the observations were therfore performed during on-transit with high probability, so any deep eclipses on these stars can be excluded. The CFHT observations futhermore detected a marginally significant signal on the target (see Fig. 4), with an ampltiude of 0.6 ± 0.2%, compatible with the 0.38% amplitude in CoRoT’s data. We concluded that there is no CEB in the field that can explain the CoRoT periodic signal and that the target star should be a good candidate for harboring a transiting planet.
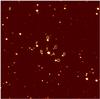 |
Fig. 3 The field of CoRoT-23, as extracted from a MEGACAM frame of 10 s taken at CFHT. The potentially contaminating stars are labeled with letters from A to G. The size of the field is ≈ 3 × 3 arcmin2. |
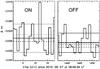 |
Fig. 4 Relative magnitude variation of CoRoT-23, as measured with CFHT-MEGACM, at two time intervals of the night 07 Sept. 2010, the first one (noted ON) during the predicted transit. The expected variation due to the transit is detected with a significant signal-to-noise ratio as shown by the 1σ range (dotted lines) for each sequence; it corresponds in amplitude and sign to the predicted one. |
3.2. Radial velocity
Nine spectra were gathered with HARPS on the 3.6 m telescope at La Silla Observatory (ESO, Chile), from 5 April from 13 May 2011. Their signal-to-noise ratio varies from six to ten at 550 nm in one-hour exposures. The spectra were extracted by the HARPS pipeline, and the RV was derived from a cross-correlation with a G2 mask (Baranne et al. 1996; Pepe et al. 2002). The cross-correlation function shows a single peak of width 12.9 km s-1, indicating a slightly rotating star. The average error bar on the velocity is 72 m s-1, while the velocity has a variation of 760 m s-1 peak-to-peak with an rms of 280 m s-1. The HARPS measurements versus time are plotted in Fig. 5. When fitted at the CoRoT ephemeris, using AMOEBA convergence and bootstrap analysis of the errors, the RV signal is compatible with a slightly eccentric Keplerian orbit with a semi-amplitude of 377 ± 11 m s-1 and e = 0.16 ± 0.02, as illustrated in Fig. 6.
HARPS RV observations of CoRoT-23.
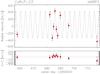 |
Fig. 5 HARPS RV measurements of CoRoT-23 obtained in 2011, versus time. The data points are shown with 1σ error bars. Superimposed is a Keplerian orbital curve of a 3.6313 day period planet at the CoRoT ephemeris. We conclude that the planet has a mass Mpl ≈ 2.8 ± 0.3 MJup. |
As indicated by Fig. 7, the bisector span does not show any significant correlation with the velocity, a good indication that the velocity signal comes from a planetary companion rather than produced by stellar activity or by a background eclipsing binary.
We conclude that the star CoRoT-23 hosts a transiting planetary companion of 2.8 ± 0.3 Jupiter masses at a semi-major axis of 0.048 AU on a significantly eccentric orbit.
3.3. Spectroscopy and stellar parameters
The central star was spectroscopically analyzed using the HARPS data set. Figure 8 shows a significant sample of the HARPS spectrum used for this analysis. By comparing the spectra with a grid of stellar templates, as described in Frasca et al. (2003) and Gandolfi et al. (2008), or using SME (Valenti & Piskunov 1996), we derived the spectral type and luminosity class of the star and the stellar parameters, which are summarized in Table 3. In short, the star is a G0 V with Teff = 5900 ± 100 K, M⋆ = 1.14 ± 0.08 M⊙, log g = 4.3 ± 0.2 and features solar type abundances: [Fe/H]: [0.05, 0.10]. Given the stellar density deduced from the transit data, the radius of the star was evaluated is 1.61 ± .18 R⊙. The stellar rotation period is estimated to be 9.2 ± 1.5 days, as derived from Vsini = 8 ± 1 km s-1. This value could match a peak at a period of 10.5 days on the periodogram of the CoRoT light curve.
 |
Fig. 6 Phase-folded HARPS RV measurements of CoRoT-23 showing the clear eccentricity of 0.16 when fitted by a Keplerian elliptical orbit. |
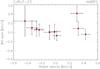 |
Fig. 7 Bisector span vs. radial velocity of the HARPS RV measurements of CoRoT-23. |
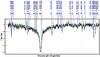 |
Fig. 8 Part of the HARPS spectrum centered on the Hα line. A fit of the spectrum using synthetic stellar spectra of Kurucz (http://kurucz.harvard.edu/grids.html) is superimposed with identification of several lines. |
Planet and star parameters.
The age of the star has been evaluated to be between 6 and 9 Gyr, using evolution tracks of main sequence and post main sequence stars in the Teff vs. M1/3/R diagram. The possibility that CoRoT-23 could be a pre-MS star is excluded since an unlikely age of 18 Myr would be constrained. Given the rather low density derived from the complete analysis and the large corresponding radius of the star (1.61 R⊙), it is likely that the star is at an evolution stage close to leaving the main sequence and evolving to a subgiant. The star/planet co-evolution diagram of Fig. 10 (see Sect. 5) also points to an age of more than 5 Gyr.
Regarding the distance estimate we have first converted the 2MASS magnitudes into the SAAO system with the relations of Carpenter (2001). The calculated colors J − H and H − K are 0.49 ± 0.03 and 0.09 ± 0.03, respectively. Using Ducati et al. (2001) for the intrinsic colors of a G0 star, we derive the color excesses from [B − V] to [H − K] and, using an extinction law towards the Galactic center region (Dutra et al. 2003), AK = 0.18 and AV = 2.42. Taking for the spectral type of CoRoT-23 an absolute magnitude of MV = 4.4 ± 0.1 (Straizys & Kuriliene 1981), the derived distance, based either on (B − V) or (J − K) indices, is 550 and 600 pc, respectively. We assume that the infrared derivation is somewhat more robust, so we retain it in Table 3.
4. Final stellar and planetary parameters
Once the stellar parameters are determined and the radial velocity analysis done, a more consistent and more accurate analysis of the CoRoT LC can be performed in a second step. Taking the eccentricity into account as measured thanks to RV data analysis (see Sect. 3.2), and the stellar parameters, as derived in Sect. 3.3 we computed the complete solution for the different parameters, summarized in Table 3. The uncertainty on each parameter is derived from its statistical distribution, as shown in Fig. 9 for six of them.
To summarize the main characteristics of the planet in one sentence: CoRoT-23b is a dense hot Jupiter (Rp = 1.05 RJ, Mp = 2.8 MJ, ρp = 3.0 g cm-3, a = 0.048 AU) with a significant eccentricity (e = 0.16) orbiting a mature G0 star.
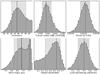 |
Fig. 9 Probability distribution of six transit parameters, obtained from the differential evolution global optimization method applied to the CoRoT transit signal, assuming a linear limb-darkening law and taking the eccentricity into account. |
5. Discussion
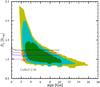 |
Fig. 10 Diagram describing the probability that CoRoT-23b has a given age and radius (the green area corresponds the highest probability), given the set of parameters deduced from the observations (photometry, spectroscopy, and radial velocity) and using a combination of stellar and planetary evolution codes to constrain the probability. The four dotted lines describe the evolution tracks of a giant gaseous planet with the different core masses as labeled. |
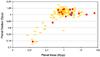 |
Fig. 11 Comparison of the different transit planets discovered by CoRoT (red squares) or by other experiments (yellow bowties), as well as CoRoT-23b (blue diamond) in a mass/radius diagram. CoRoT-23b lies on the curve that joins the densest CoRoT planets. |
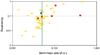 |
Fig. 12 Diagram of eccentricity vs. semi-major axis of the different transiting planets that have no-zero eccentricity. We display with different symbols the ones discovered by CoRoT (red squares), by other experiments (yellow bowties), and by CoRoT-23b (blue diamond). The vertical line marks an arbitrary frontier between hot and warm Jupiters. |
CoRoT-23b appears as a hot Jupiter that is both rather dense and features a significant eccentricity, two characteritics that are not typical for this class of exoplanets. On the mass/radius diagram of Fig. 11 we plotted the various transit planets discovered by CoRoT or by other experiments as well as CoRoT-23b. CoRoT-23b appears to lie at the lower boundary of the domain of planets discovered by CoRoT, meaning that it is among the densest members. Does this property translate the age of the system, which is close to 7.5 Gyr, a time sufficient for the almost full contraction of the planet? This is one plausible explanation, that is consistent with a combined modeling of the star (Morel & Lebreton 2008; Marigo et al. 2008) and the planet (Guillot & Morel 1995) in a system (Guillot & Havel 2011; Havel et al. 2011), as illustrated in Fig. 10 where the probability that CoRoT-23b has a given age and radius is indicated by a color, the green area corresponding to the highest probability. Evolution tracks of a giant gaseous planet with different core masses are superimposed, and suggest that a rather massive core (300 MEarth) is required, if the age of the system is indeed close to 7.5 Gyr. However, the observations do not constrain the radius of the planet very well (13% of uncertainty), and thus other solutions for the core mass remain, ranging from 0 to about 350–400 MEarth. In our planetary evolution calculations, we assumed that (i) all heavy elements are grouped into a dense central core, surrounded by a solar-composition H/He envelope (see Baraffe et al. 2008, for a discussion); (ii) 0.25% of the incoming stellar flux is dissipated deep into the planetary interior (Guillot 2008). We estimate that these assumptions would have a small effect on the determination of the core mass (less than 10%) as compared to the uncertainty due to the observations.
As regards the eccentricity, CoRoT-23b, with e = 0.16, has the fourth most eccentric orbits of all planets discovered by CoRoTand the 14th of the 172 confirmed transit planets (June 2011); it features one of the most eccentric orbits of the hot Jupiter class, as illustrated in Fig. 12. For instance, if we consider a boundary at a semi-major axis of 0.05 AU between hot and warm Jupiters, the median eccentricity (excluding all zero eccentricity planets) is 0.06 for the former (closer orbits) and 0.11 for the later (wider orbits). CoRoT-23b is clearly distinct from other hot Jupiters of its group in this respect. It is generally admitted and statistically consistent that the low eccentricity of hot Jupiters results from circularization through tidal interaction between the star and the planet, more precisely by tides raised on the planet and/or during the migration, since the disk also tends to damp the eccentricity (Moeckel et al. 2008). The last mechanism however has a much shorter time constant (0.1–10 Myr) than the age of the system. On the other hand, in a few recent cases, no-zero eccentricities of planets on close orbits (Hellier et al. 2010; Hebb et al. 2010, 2009) raised interest in alternate scenarii based on the presence of a companion that gravitationnaly perturbes the orbit. Is that the case here? This being said, we note that the circularization efficiency and time constant depend on several parameters, such as the mass of the planet and the orbital distance. Pont et al. (2011) examine this question from a statistical point of view and show that the frontier between fully circularized planets and eccentric ones is fairly well defined in the diagram of mass vs. orbital distance (see their Fig. 3). Not all short-period planets have zero eccentricity, even in a tide-driven circularization scenario.
In these conditions, does that no-zero eccentricity of CoRoT-23b result from a normal secular evolution or does it reflect the recent gravitational effect from other putative planets in the system is a question that deserves some further studies.
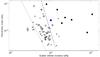 |
Fig. 13 CoRoT-23b (blue dot) added on the Mpl/ M⋆vs. a/Rpl diagram proposed by Pont et al. (2011). CoRoT-23b appears to lie outside the band of circularized planets. |
We first added the case of CoRoT-23b in Fig. 3 of Pont et al. (2011), i.e. the Mpl/ M⋆vs. a/Mpl plane, as shown in Fig. 13. CoRoT-23b appears not far, but clearly outside the band of circularized planets. This is a first hint that a perturbating companion is not mandatory and that the no-zero eccentricity of CoRoT-23b could just be due to a long time constant for circularization because of its mass and distance to the star.
We tried then to put some constraints on the tidal quality factor Qp that governs the damping of the eccentricity of CoRoT-23b. Following Matsumura et al. (2010), we assume that the eccentricity evolution only depends on the tidal dissipation inside the planet, so that de/dt is described by Eq. (17) of Matsumura et al. (2010). We computed the evolution of e with time starting from two situations of a rather high eccentricity (0.8 and 0.5) just after the formation of the planet. This is illustrated in Fig. 14 where several acceptable values for Qp were considered. We find that the damping would be fast enough to circularize the orbit only for the lowest initial eccentricity and the lowest value of Qp. We conclude that, if the CoRoT-23 system is indeed mature with an age, say over 5 Gyr, then the damping of the eccentricity should have been slow, a condition reached as soon as Qp is greater that 3 × 10⁵. This value appears to be well within the pausible range and even at the lower bound: no unusual response of CoRoT-23b to tides would then be required to explain its eccentricity.
We note also that, compared to CoRoT-20 (Deleuil et al. 2012), the system has a larger stellar property factor (as defined by Pätzold & Rauer 2002) by a factor of 10 and a larger Doodson contant (as defined by Pätzold et al. 2004). The consequence could be that the planet may get lost in the star in a time comparable to the age of the system if Q∗/k2 ∗ is less than 107, where Q∗ is the stellar tidal energy dissipation factor and k2 ∗ is the stellar Love number. This preliminary analysis will be developed in a forthcoming paper.
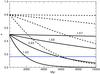 |
Fig. 14 Evolution of the eccentricity of CoRoT-23b with time (in Myr) for two initial conditions (e = 0.5: solid lines and e = 0.8: dash lines) and four different values of the tidal quality factor Qp: 105, 3 × 10⁵, 106, and 107. The evolution of e was computed using Eq. (17) of Matsumura et al. (2010) and the parameters of Table 3. The horizontal blue line corresponds to the measured eccentricity of CoRoT-23b. |
6. Conclusions
After the discovery by the CoRoT satellite of transit-like photometric events on the star CoRoT-23, a planet that we called CoRoT-23b was eventually confirmed using ground-based photometric and spectroscopic follow-up observations. The amplitude of transits is ΔF/F ≈ 4.3 × 10⁻³ ± 0.1 × 10⁻³, as detected by the satellite. The star, characterized with high-resolution spectroscopy has the spectral type G0 V and is considered to be mature, i.e. close to leaving the main sequence. The planetary mass resulting from RV measurements is Mpl ≈ 2.8 MJup. The planetary orbital period, 3.6314 days, indicates that the planet belongs to the now classical hot Jupiter class.
What is less classical is that it features an eccentricity at the significant level of 0.16. A second intriguing pecularity is the density ρp = 3 g cm-3, which makes CoRoT-23b among the
densest exoplanets of this category. Those two properties clearly do not usually pertain to that class of hot Jupiters.
We, however, show that both characteristics are not all that extraordinary, because the density is likely the consequence of the long duration of the planet contraction and maybe of a rather massive core, while the eccentricity is consistent with a tide-driven damping during 5–10 Gyr of a medium mass Jupiter at an orbital distance on the order of 0.05 AU. CoRoT-23b very likely belongs to this class, recently identified, of exoplanets that are within the zone of the parameters space where a complete circularization is not achieved, even after 7.5 Gyr.
12 000 until Oct. 2009, but at this date, control of one of the two CCDs was lost, probably because of a high-energy particle hit on the onboard computer.
Acknowledgments
The authors are grateful to all the people that have worked on and operated the CoRoT satellite. The team at the IAC acknowledges support by grants ESP2007-65480-C02-02 and AYA2010-20982-C02-02 of the Spanish Ministry of Science and Innovation (MICINN). The CoRoT/Exoplanet catalogue (Exo-Dat) was made possible by observations collected for years at the Isaac Newton Telescope (INT), operated on the island of La Palma by the Isaac Newton group in the Spanish Observatorio del Roque de Los Muchachos of the Instituto de Astrophysica de Canarias. The German CoRoT Team (Thüringer Landessternwarte and University of Cologne) acknowledges the support of grants 50OW0204, 50OW603, and 50QM1004 from the Deutsches Zentrum für Luft- und Raumfahrt e.V. (DLR).
References
- Baglin, A., Auvergne, M., Boisnard, L., et al. 2006, in COSPAR, Plenary Meeting, 36th COSPAR Scientific Assembly, 36, 3749 [Google Scholar]
- Baraffe, I., Chabrier, G., & Barman, T. 2008, A&A, 482, 315 [NASA ADS] [CrossRef] [EDP Sciences] [Google Scholar]
- Baranne, A., Queloz, D., Mayor, M., et al. 1996, A&AS, 119, 373 [NASA ADS] [CrossRef] [EDP Sciences] [Google Scholar]
- Boulade, O., Charlot, X., Abbon, P., et al. 2003, in SPIE Conf. Ser., 4841, ed. M. Iye, & A. F. M. Moorwood, 72 [Google Scholar]
- Carpano, S., Cabrera, J., Alonso, R., et al. 2009, A&A, 506, 491 [NASA ADS] [CrossRef] [EDP Sciences] [Google Scholar]
- Carpenter, J. M. 2001, AJ, 121, 2851 [NASA ADS] [CrossRef] [Google Scholar]
- Charbonneau, D., Brown, T. M., Latham, D. W., & Mayor, M. 2000, ApJ, 529, L45 [NASA ADS] [CrossRef] [PubMed] [Google Scholar]
- Deeg, H. J., Gillon, M., Shporer, A., et al. 2009, A&A, 506, 343 [NASA ADS] [CrossRef] [EDP Sciences] [Google Scholar]
- Deeg, H. J., Moutou, C., Erikson, A., et al. 2010, Nature, 464, 384 [NASA ADS] [CrossRef] [PubMed] [Google Scholar]
- Deleuil, M., Meunier, J. C., Moutou, C., et al. 2009, AJ, 138, 649 [NASA ADS] [CrossRef] [Google Scholar]
- Deleuil, M., Bonomo, A., Ferraz-Mello, S., et al. 2012, A&A, in press, Doi: 10.1051/0004-6361/201117681 [Google Scholar]
- Ducati, J. R., Bevilacqua, C. M., Rembold, S. B., & Ribeiro, D. 2001, ApJ, 558, 309 [NASA ADS] [CrossRef] [Google Scholar]
- Dutra, C. M., Santiago, B. X., Bica, E. L. D., & Barbuy, B. 2003, MNRAS, 338, 253 [NASA ADS] [CrossRef] [Google Scholar]
- Frasca, A., Alcalá, J. M., Covino, E., et al. 2003, A&A, 405, 149 [NASA ADS] [CrossRef] [EDP Sciences] [Google Scholar]
- Gandolfi, D., Alcalá, J. M., Leccia, S., et al. 2008, ApJ, 687, 1303 [NASA ADS] [CrossRef] [Google Scholar]
- Gregory, P. C. 2007, MNRAS, 381, 1607 [NASA ADS] [CrossRef] [MathSciNet] [Google Scholar]
- Guillot, T. 2008, Phys. Scrip. Vol. T, 130, 014023 [Google Scholar]
- Guillot, T., & Morel, P. 1995, A&AS, 109, 109 [NASA ADS] [Google Scholar]
- Guillot, T., & Havel, M. 2011, A&A, 527, A20 [NASA ADS] [CrossRef] [EDP Sciences] [Google Scholar]
- Havel, M., Guillot, T., Valencia, D., & Crida, A. 2011, A&A, 531, A3 [NASA ADS] [CrossRef] [EDP Sciences] [Google Scholar]
- Hebb, L., Collier-Cameron, A., Loeillet, B., et al. 2009, ApJ, 693, 1920 [NASA ADS] [CrossRef] [Google Scholar]
- Hebb, L., Collier-Cameron, A., Triaud, A. H. M. J., et al. 2010, ApJ, 708, 224 [NASA ADS] [CrossRef] [Google Scholar]
- Hellier, C., Anderson, D. R., Collier Cameron, A., et al. 2010, ApJ, 723, L60 [NASA ADS] [CrossRef] [Google Scholar]
- Kipping, D. M. 2010, MNRAS, 407, 301 [NASA ADS] [CrossRef] [Google Scholar]
- Marigo, P., Girardi, L., Bressan, A., et al. 2008, A&A, 482, 883 [NASA ADS] [CrossRef] [EDP Sciences] [Google Scholar]
- Matsumura, S., Peale, S. J., & Rasio, F. A. 2010, ApJ, 725, 1995 [NASA ADS] [CrossRef] [Google Scholar]
- Moeckel, N., Raymond, S. N., & Armitage, P. J. 2008, in AAS/Division of Dynamical Astronomy Meeting, 39, 15.15 [Google Scholar]
- Morel, P., & Lebreton, Y. 2008, Ap&SS, 316, 61 [NASA ADS] [CrossRef] [MathSciNet] [Google Scholar]
- Pätzold, M., & Rauer, H. 2002, ApJ, 568, L117 [NASA ADS] [CrossRef] [Google Scholar]
- Pätzold, M., Carone, L., & Rauer, H. 2004, A&A, 427, 1075 [NASA ADS] [CrossRef] [EDP Sciences] [Google Scholar]
- Pepe, F., Mayor, M., Galland, F., et al. 2002, A&A, 388, 632 [NASA ADS] [CrossRef] [EDP Sciences] [Google Scholar]
- Pont, F., Husnoo, N., Mazeh, T., & Fabrycky, D. 2011, MNRAS, 414, 1278 [NASA ADS] [CrossRef] [Google Scholar]
- Rouan, D., Baglin, A., Copet, E., et al. 1998, Earth Moon and Planets, 81, 79 [NASA ADS] [CrossRef] [Google Scholar]
- Straizys, V., & Kuriliene, G. 1981, Ap&SS, 80, 353 [NASA ADS] [CrossRef] [Google Scholar]
- Valenti, J. A., & Piskunov, N. 1996, A&AS, 118, 595 [NASA ADS] [CrossRef] [EDP Sciences] [Google Scholar]
- Veras, D., & Ford, E. B. 2009, ApJ, 690, L1 [NASA ADS] [CrossRef] [Google Scholar]
All Tables
All Figures
|
Fig. 1 CoRoT LC of the target CoRoT-23. The apparent change of regime at CoRoT JD 3783 corresponds to the change in the sampling period from 512 s to 32 s. Upper panel: raw data (in black), at a unique sampling period of 512 s (blue) and after a median-smoothing on 10 h (purple). Lower panel: LC after applying a detrending filter. |
| In the text | |
|
Fig. 2 Phase-folded LC of CoRoT-23b using the ephemeris given in Table 3 with, superimposed, a simple trapezoidal fit. |
| In the text | |
|
Fig. 3 The field of CoRoT-23, as extracted from a MEGACAM frame of 10 s taken at CFHT. The potentially contaminating stars are labeled with letters from A to G. The size of the field is ≈ 3 × 3 arcmin2. |
| In the text | |
|
Fig. 4 Relative magnitude variation of CoRoT-23, as measured with CFHT-MEGACM, at two time intervals of the night 07 Sept. 2010, the first one (noted ON) during the predicted transit. The expected variation due to the transit is detected with a significant signal-to-noise ratio as shown by the 1σ range (dotted lines) for each sequence; it corresponds in amplitude and sign to the predicted one. |
| In the text | |
|
Fig. 5 HARPS RV measurements of CoRoT-23 obtained in 2011, versus time. The data points are shown with 1σ error bars. Superimposed is a Keplerian orbital curve of a 3.6313 day period planet at the CoRoT ephemeris. We conclude that the planet has a mass Mpl ≈ 2.8 ± 0.3 MJup. |
| In the text | |
|
Fig. 6 Phase-folded HARPS RV measurements of CoRoT-23 showing the clear eccentricity of 0.16 when fitted by a Keplerian elliptical orbit. |
| In the text | |
|
Fig. 7 Bisector span vs. radial velocity of the HARPS RV measurements of CoRoT-23. |
| In the text | |
|
Fig. 8 Part of the HARPS spectrum centered on the Hα line. A fit of the spectrum using synthetic stellar spectra of Kurucz (http://kurucz.harvard.edu/grids.html) is superimposed with identification of several lines. |
| In the text | |
|
Fig. 9 Probability distribution of six transit parameters, obtained from the differential evolution global optimization method applied to the CoRoT transit signal, assuming a linear limb-darkening law and taking the eccentricity into account. |
| In the text | |
|
Fig. 10 Diagram describing the probability that CoRoT-23b has a given age and radius (the green area corresponds the highest probability), given the set of parameters deduced from the observations (photometry, spectroscopy, and radial velocity) and using a combination of stellar and planetary evolution codes to constrain the probability. The four dotted lines describe the evolution tracks of a giant gaseous planet with the different core masses as labeled. |
| In the text | |
|
Fig. 11 Comparison of the different transit planets discovered by CoRoT (red squares) or by other experiments (yellow bowties), as well as CoRoT-23b (blue diamond) in a mass/radius diagram. CoRoT-23b lies on the curve that joins the densest CoRoT planets. |
| In the text | |
|
Fig. 12 Diagram of eccentricity vs. semi-major axis of the different transiting planets that have no-zero eccentricity. We display with different symbols the ones discovered by CoRoT (red squares), by other experiments (yellow bowties), and by CoRoT-23b (blue diamond). The vertical line marks an arbitrary frontier between hot and warm Jupiters. |
| In the text | |
|
Fig. 13 CoRoT-23b (blue dot) added on the Mpl/ M⋆vs. a/Rpl diagram proposed by Pont et al. (2011). CoRoT-23b appears to lie outside the band of circularized planets. |
| In the text | |
|
Fig. 14 Evolution of the eccentricity of CoRoT-23b with time (in Myr) for two initial conditions (e = 0.5: solid lines and e = 0.8: dash lines) and four different values of the tidal quality factor Qp: 105, 3 × 10⁵, 106, and 107. The evolution of e was computed using Eq. (17) of Matsumura et al. (2010) and the parameters of Table 3. The horizontal blue line corresponds to the measured eccentricity of CoRoT-23b. |
| In the text | |
Current usage metrics show cumulative count of Article Views (full-text article views including HTML views, PDF and ePub downloads, according to the available data) and Abstracts Views on Vision4Press platform.
Data correspond to usage on the plateform after 2015. The current usage metrics is available 48-96 hours after online publication and is updated daily on week days.
Initial download of the metrics may take a while.