Free Access
Fig. 8
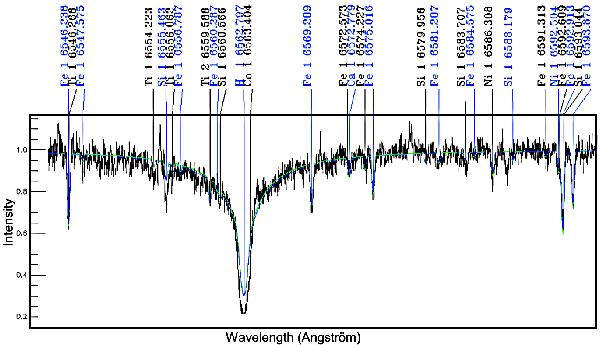
Part of the HARPS spectrum centered on the Hα line. A fit of the spectrum using synthetic stellar spectra of Kurucz (http://kurucz.harvard.edu/grids.html) is superimposed with identification of several lines.
Current usage metrics show cumulative count of Article Views (full-text article views including HTML views, PDF and ePub downloads, according to the available data) and Abstracts Views on Vision4Press platform.
Data correspond to usage on the plateform after 2015. The current usage metrics is available 48-96 hours after online publication and is updated daily on week days.
Initial download of the metrics may take a while.