Fig. 4
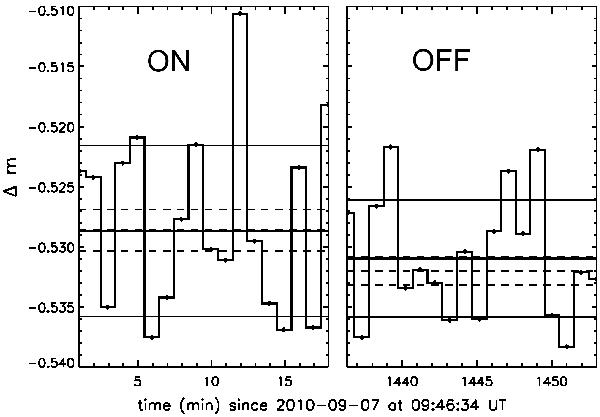
Relative magnitude variation of CoRoT-23, as measured with CFHT-MEGACM, at two time intervals of the night 07 Sept. 2010, the first one (noted ON) during the predicted transit. The expected variation due to the transit is detected with a significant signal-to-noise ratio as shown by the 1σ range (dotted lines) for each sequence; it corresponds in amplitude and sign to the predicted one.
Current usage metrics show cumulative count of Article Views (full-text article views including HTML views, PDF and ePub downloads, according to the available data) and Abstracts Views on Vision4Press platform.
Data correspond to usage on the plateform after 2015. The current usage metrics is available 48-96 hours after online publication and is updated daily on week days.
Initial download of the metrics may take a while.