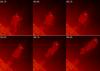
Fig. 2
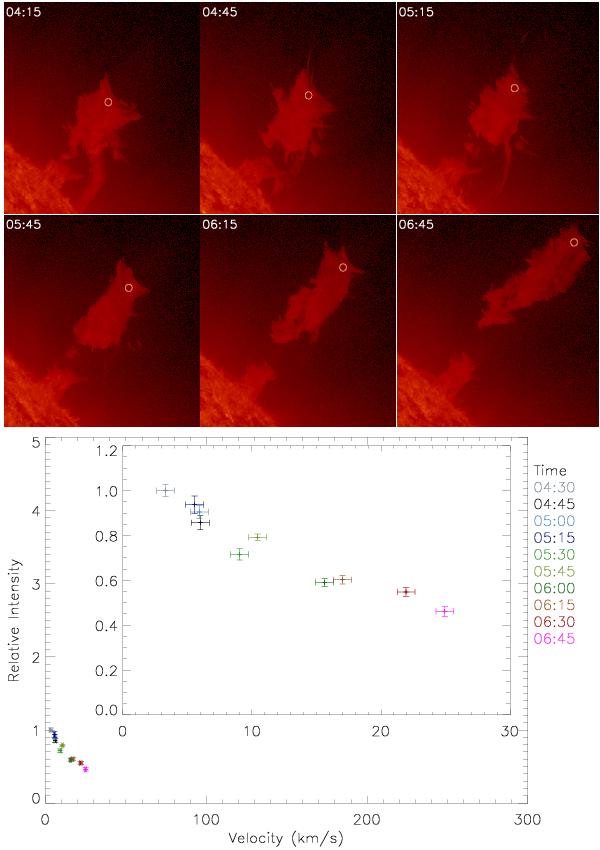
Top: evolution of the 2010-06-13 prominence eruption. The circle marks the part of the prominence which was tracked and used to calculate the intensities. The field of view in the images is 300′′ × 300′′. Bottom: variation of relative intensity as a function of velocity in the plane of the sky. Intensities are normalised by the intensity corresponding to the lowest velocity. The inset shows the relative intensity variation with axis scales specific to this event. The time evolution is coded in color (with the time-scale indicated on the right of the plot) in the online version of the figure.
Current usage metrics show cumulative count of Article Views (full-text article views including HTML views, PDF and ePub downloads, according to the available data) and Abstracts Views on Vision4Press platform.
Data correspond to usage on the plateform after 2015. The current usage metrics is available 48-96 hours after online publication and is updated daily on week days.
Initial download of the metrics may take a while.