Fig. 5
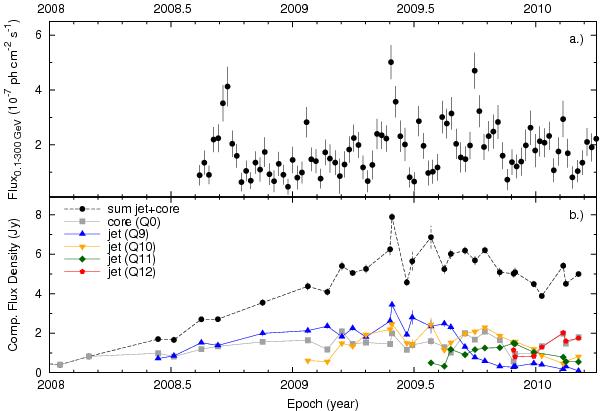
top: Fermi LAT 7-day binned γ-ray light curve of 3C 345 for the energy range of 0.1–300 GeV. bottom: VLBA 7 mm component flux densities for the modelfitted to the VLBI core and inner jet, represented by up to five circular Gaussian components (Q0, Q12, Q11, Q10, Q9). The component labeled Q0 is the east-most component (see Fig. 1) and represents the compact “core” or base of the jet. The black curve plots the sum of the flux densities of all four components.
Current usage metrics show cumulative count of Article Views (full-text article views including HTML views, PDF and ePub downloads, according to the available data) and Abstracts Views on Vision4Press platform.
Data correspond to usage on the plateform after 2015. The current usage metrics is available 48-96 hours after online publication and is updated daily on week days.
Initial download of the metrics may take a while.