Fig. 4
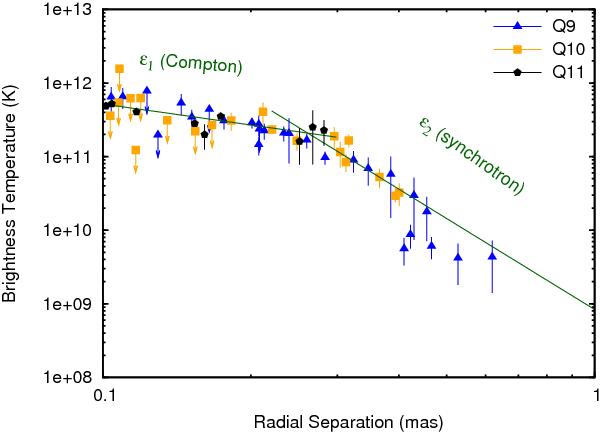
Component brightness temperatures against radial separation from the VLBI core
(Q0), representing the emission intensity gradient along the jet. Points with
arrows are 1σ upper limits. Two lines are fitted to the data to
determine the power-law indices ϵ
( )
from the data, the fit from 0.1 to 0.3 mas yields
ϵ1 = 0.95 ± 0.69 and 0.3–0.65 mas yields
ϵ2 = 4.11 ± 0.85.
)
from the data, the fit from 0.1 to 0.3 mas yields
ϵ1 = 0.95 ± 0.69 and 0.3–0.65 mas yields
ϵ2 = 4.11 ± 0.85.
Current usage metrics show cumulative count of Article Views (full-text article views including HTML views, PDF and ePub downloads, according to the available data) and Abstracts Views on Vision4Press platform.
Data correspond to usage on the plateform after 2015. The current usage metrics is available 48-96 hours after online publication and is updated daily on week days.
Initial download of the metrics may take a while.