Fig. 2
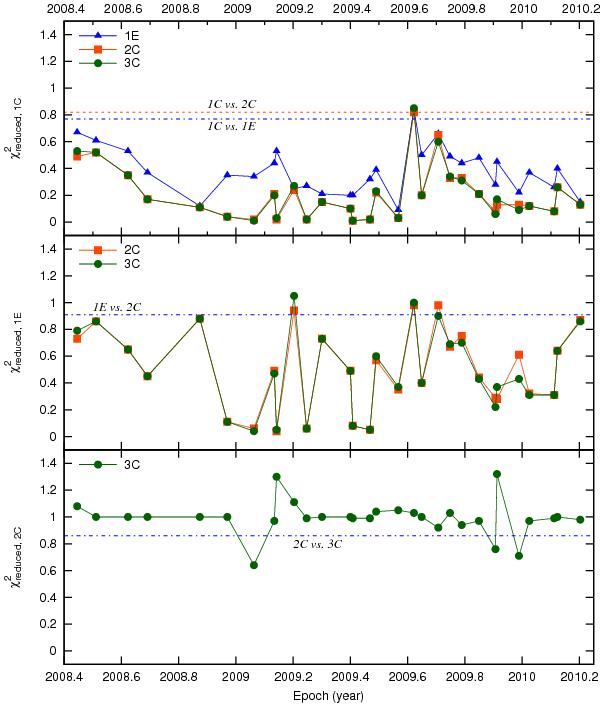
Reduced χ2 parameters of the modelfit representations
of the core region. The top panel shows the resulting
 values of the 1E, 2C, and 3C Gaussian models normalized to the value of the 1C
Gaussian representation. The two horizontal lines mark the limit below which, for
the corresponding model, a significant improvement (68% confidence) over 1C is given
(0.77, 0.82). Similarly, the middle panel shows the
values for 2C and 3C normalized to that of 1E. The horizontal line marks the
significant improvement level relative to 2C (0.91). The bottom panel normalizes the
χ2 values to that of 2C. The dashed line plots the
significant improvement limit for 3C (0.86).
values of the 1E, 2C, and 3C Gaussian models normalized to the value of the 1C
Gaussian representation. The two horizontal lines mark the limit below which, for
the corresponding model, a significant improvement (68% confidence) over 1C is given
(0.77, 0.82). Similarly, the middle panel shows the
values for 2C and 3C normalized to that of 1E. The horizontal line marks the
significant improvement level relative to 2C (0.91). The bottom panel normalizes the
χ2 values to that of 2C. The dashed line plots the
significant improvement limit for 3C (0.86).
Current usage metrics show cumulative count of Article Views (full-text article views including HTML views, PDF and ePub downloads, according to the available data) and Abstracts Views on Vision4Press platform.
Data correspond to usage on the plateform after 2015. The current usage metrics is available 48-96 hours after online publication and is updated daily on week days.
Initial download of the metrics may take a while.