Fig. 1
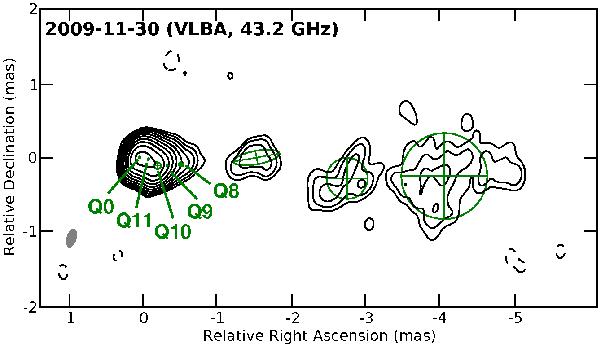
VLBA image of the total brightness distribution of 3C 345 at 43.2 GHz made from observations on Nov. 30, 2009. Open crossed circles show the FWHM of eight Gaussian components applied to fit the structure observed. The shaded ellipse, in the lower left corner, represents the FWHM of the restoring beam. The image peak flux density is 2.1 Jy beam-1 and the RMS noise is 1 mJy beam-1. The contour levels are (–0.15, 0.15, 0.3, 0.6, 1.2, 2.4, 4.8, 9.6, 19, 38, 77)% of the peak flux density. Here the nuclear region is modeled by two circular Gaussian components (Q0, Q11) identified as the best representation of the observed brightness distribution.
Current usage metrics show cumulative count of Article Views (full-text article views including HTML views, PDF and ePub downloads, according to the available data) and Abstracts Views on Vision4Press platform.
Data correspond to usage on the plateform after 2015. The current usage metrics is available 48-96 hours after online publication and is updated daily on week days.
Initial download of the metrics may take a while.