Fig. 6
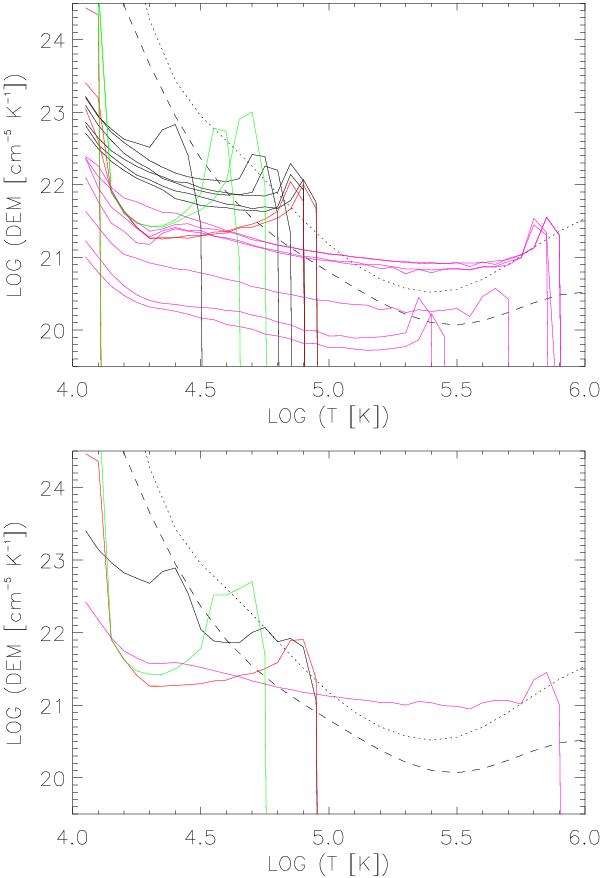
Top: calculated DEMs for the quasi-static cool loops 1–6 (solid black lines), 14–16 (red), 24–26 (green) and the intermediate-temperature loops 17–23 (magenta) of Table 1, compared to the DEMs of the quiet Sun (dashed) and active region (dotted) from the “CHIANTI” atomic data base (Dere et al. 2009). Bottom: total DEMs for each group of loops shown in the top panel.
Current usage metrics show cumulative count of Article Views (full-text article views including HTML views, PDF and ePub downloads, according to the available data) and Abstracts Views on Vision4Press platform.
Data correspond to usage on the plateform after 2015. The current usage metrics is available 48-96 hours after online publication and is updated daily on week days.
Initial download of the metrics may take a while.