Fig. 7
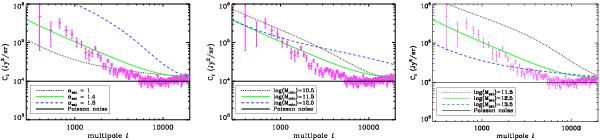
CIBA power spectrum at 160 μm obtained using several values of αsat,Mmin, and Msat. The level of the Poisson noise has also been added to the power spectra (black continous line). Pink dots are the data from Lagache et al. (2007) at 160 μm. When fixed, the parameters are those of the fiducial model, αsat = 1.4, Mmin = 1011.5 M⊙, and Msat = 1012.5 M⊙. Left panel: the blue line is for αsat = 1.8, the green one for αsat = 1.4 and the black one for αsat = 1. Middle panel: the blue line is the clustering power spectrum for Mmin = 1012.5 M⊙, the green one for Mmin = 1011.5 M⊙, and the black one for Mmin = 1010.5 M⊙. Right panel: the blue line is for Msat = 1013.5 M⊙, the green one for Msat = 1012.5 M⊙, and the black one for Msat = 1011.5 M⊙.
Current usage metrics show cumulative count of Article Views (full-text article views including HTML views, PDF and ePub downloads, according to the available data) and Abstracts Views on Vision4Press platform.
Data correspond to usage on the plateform after 2015. The current usage metrics is available 48-96 hours after online publication and is updated daily on week days.
Initial download of the metrics may take a while.