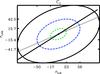
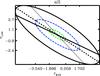
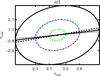
Fig. 5
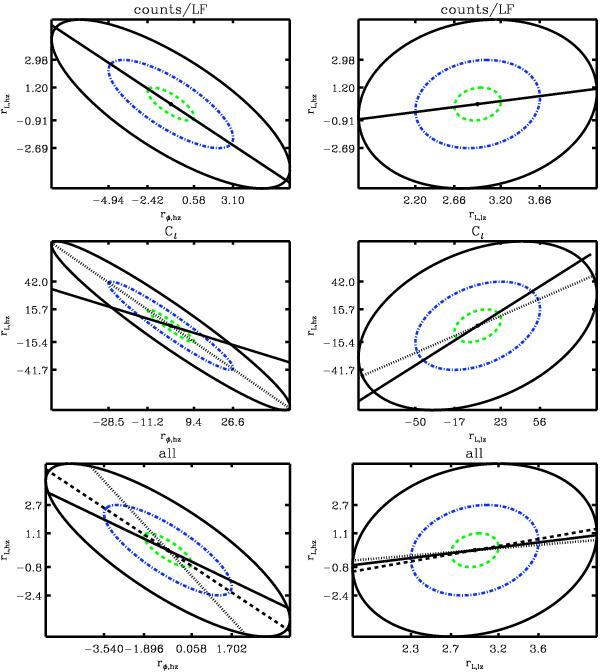
1σ (dashed green), 2σ (dash-dot blue), 3σ (black) likelihood contours of the galaxy evolution model parameters rL⋆, hz, rL⋆, lz, and rφ⋆, hz. Top, middle and bottom panels show the contours computed using counts/LF data, Cℓ data only, and combined counts/LF and Cℓ data, respectively. The continous line shows the direction of degeneracy using only counts/LF, the dotted line shows that using Cℓ and the dashed line is uses all data.
Current usage metrics show cumulative count of Article Views (full-text article views including HTML views, PDF and ePub downloads, according to the available data) and Abstracts Views on Vision4Press platform.
Data correspond to usage on the plateform after 2015. The current usage metrics is available 48-96 hours after online publication and is updated daily on week days.
Initial download of the metrics may take a while.