Fig. 4
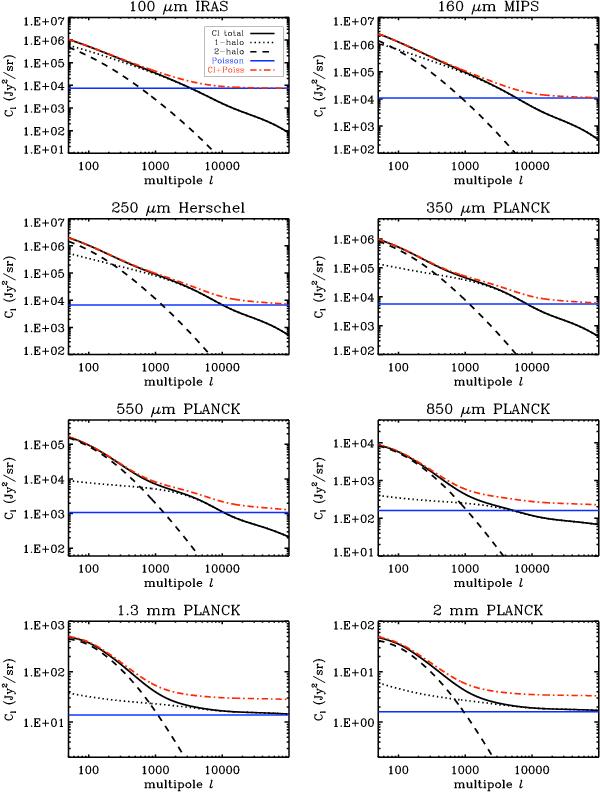
CIB anisotropies power spectra at several wavelengths. The continous black line shows the power spectra of the clustering. The dotted black line is the 1-halo term of the power spectrum, and the dashed line is the 2-halo term. The blue horizontal line represents the shot noise level and the red dot-dashed curve is the total power spectrum. Titles of the plots give the reference for the shot noise level and the bandpass filters used.
Current usage metrics show cumulative count of Article Views (full-text article views including HTML views, PDF and ePub downloads, according to the available data) and Abstracts Views on Vision4Press platform.
Data correspond to usage on the plateform after 2015. The current usage metrics is available 48-96 hours after online publication and is updated daily on week days.
Initial download of the metrics may take a while.