Fig. 12
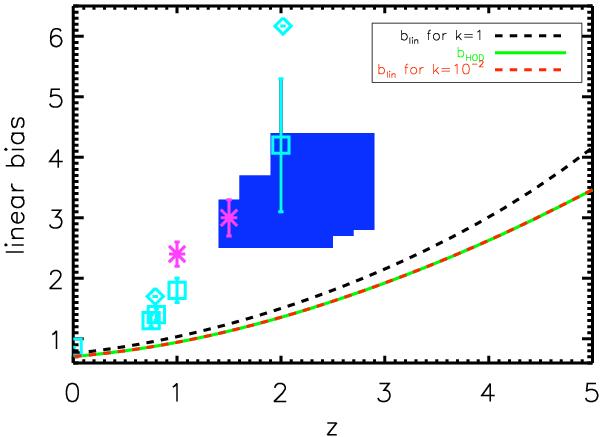
Linear bias for several values of k (in (Mpc/h)-1) and HOD bias. Light blue squares and diamonds bias values from resolved galaxies and pink crosses represent biases from unresolved galaxies measurements (see Table 4). The big blue squares represent the HOD biases coming from resolved galaxies from Cooray et al. (2010). Light blue diamonds and squares show HOD and linear biases, respectively.
Current usage metrics show cumulative count of Article Views (full-text article views including HTML views, PDF and ePub downloads, according to the available data) and Abstracts Views on Vision4Press platform.
Data correspond to usage on the plateform after 2015. The current usage metrics is available 48-96 hours after online publication and is updated daily on week days.
Initial download of the metrics may take a while.