Fig. 10
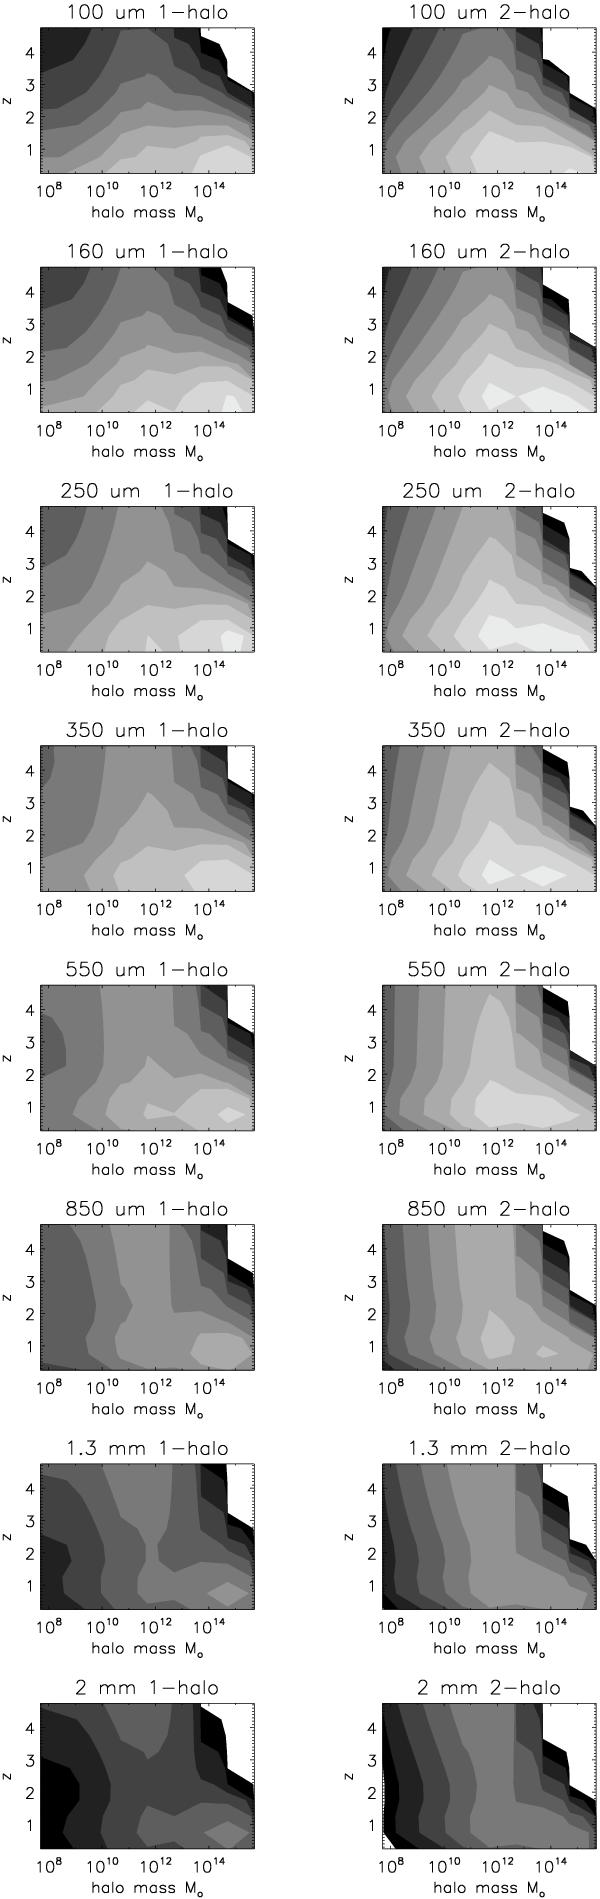
Contribution of halo masses and redshift to the Cℓ from 100 μm to 2 mm. The first column shows the redshift and mass contribution to the 1-halo term (ℓ = 2002) and the second column represents the same contributions to the 2-halo term (ℓ = 100). The light gray corresponds to the highest contribution to the Cℓs. The step of the color range is logarithmic, and the scale is the same for both columns.
Current usage metrics show cumulative count of Article Views (full-text article views including HTML views, PDF and ePub downloads, according to the available data) and Abstracts Views on Vision4Press platform.
Data correspond to usage on the plateform after 2015. The current usage metrics is available 48-96 hours after online publication and is updated daily on week days.
Initial download of the metrics may take a while.