Fig. 2
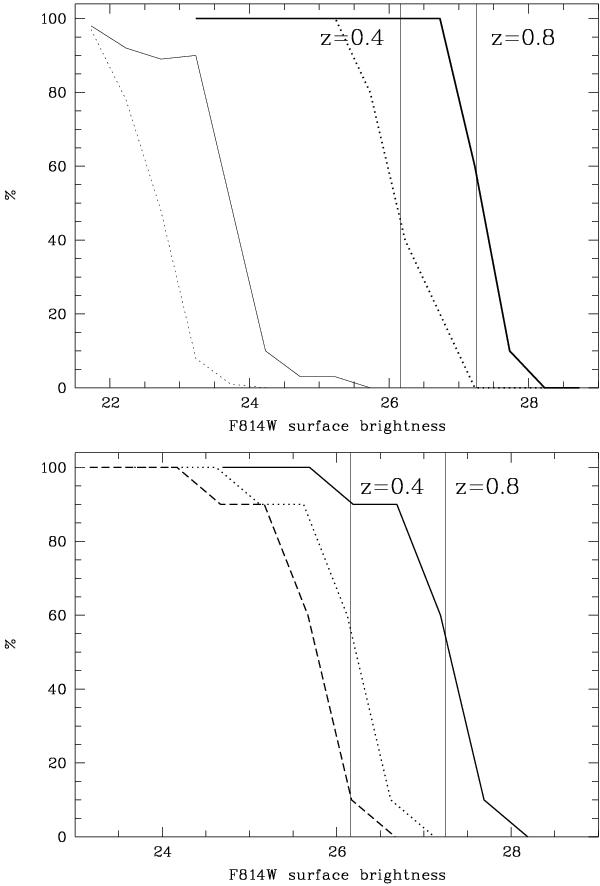
Upper panel: percentage of recovered diffuse light sources in HST ACS images. Curves to the right are related to the wavelet detections. Curves to the left are relative to the SExtractor detections. Dotted curves are relative to shallow HST ACS image areas. Continuous curves are relative to deep HST ACS image areas. The two vertical lines show the brightest Coma cluster known diffuse light source (a ~ 60 kpc wide source) redshifted to z = 0.4 and z = 0.8. Lower panel: percentage of recovered diffuse light sources in FORS2 V-band images. The two vertical lines show the brightest known Coma cluster diffuse light source redshifted to z = 0.4 and z = 0.8. All curves correspond to the wavelet detection. The continuous curve represents very blue objects (V − F814W = 1), the dotted curve blue objects (V − F814W = 2.1), and the dashed curve red objects (V − F814W = 2.6).
Current usage metrics show cumulative count of Article Views (full-text article views including HTML views, PDF and ePub downloads, according to the available data) and Abstracts Views on Vision4Press platform.
Data correspond to usage on the plateform after 2015. The current usage metrics is available 48-96 hours after online publication and is updated daily on week days.
Initial download of the metrics may take a while.