Fig. 15
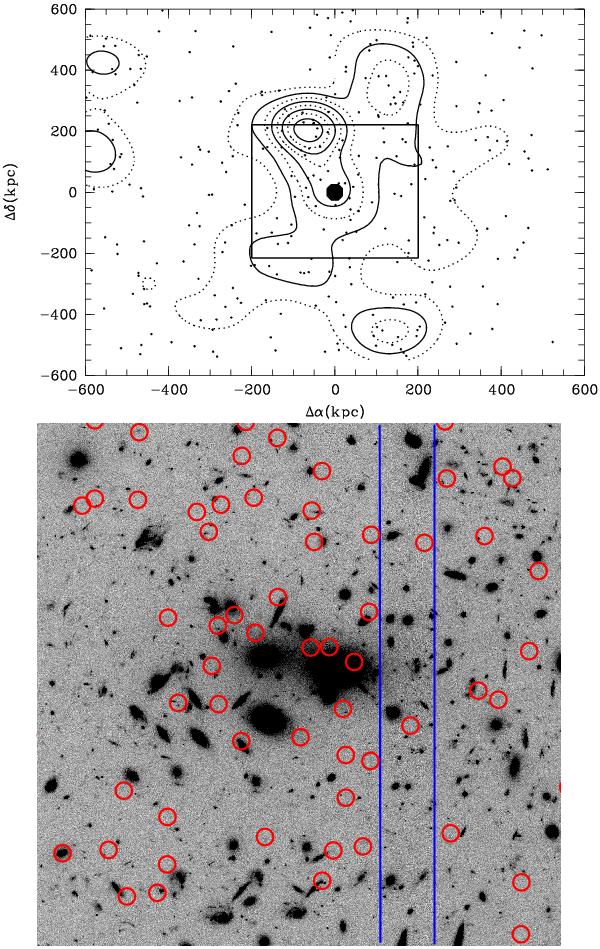
Upper figure: stacked physical spatial map of the WDCOs detected in the clusters analyzed in both V and F814W bands. Density contours start at the 3σ level and are in steps of 1σ. The area limited by the inner square is shown in the lower figure. Lower figure: stacked and rescaled images of LCDCS 0110, LCDCS 0340, and LCDCS 0541 (see text). Red circles are the detected WDCOs. The two blue lines delimit a lower signal to noise region.
Current usage metrics show cumulative count of Article Views (full-text article views including HTML views, PDF and ePub downloads, according to the available data) and Abstracts Views on Vision4Press platform.
Data correspond to usage on the plateform after 2015. The current usage metrics is available 48-96 hours after online publication and is updated daily on week days.
Initial download of the metrics may take a while.