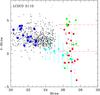
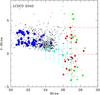
Fig. 13
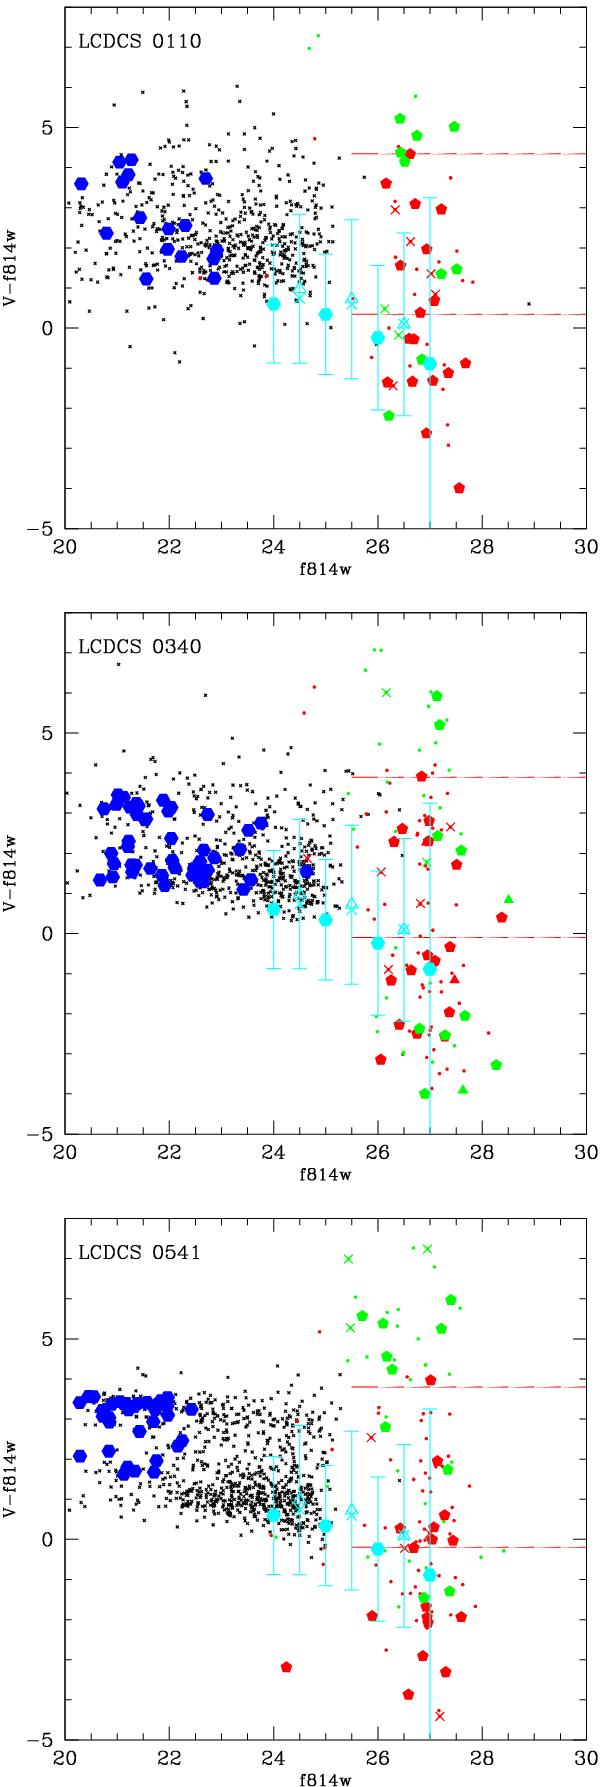
Color–magnitude diagram V − F814W versus F814W for the three considered clusters. Black dots represent the SExtractor-detected objects along the considered lines of sight. Blue-filled hexagons are the SExtractor-detected objects in each cluster according to their spectroscopic redshift. Triangles are WDCOs with a χ2 lower than 8, crosses with a χ2 between 8 and 10, pentagons with a χ2 between 10 and 15, and small dots with higher χ2 values. For these last four classes, red is the color for WDCOs detected in the first pass and green in the second pass. The red lines limit the space in which the objects are likely to belong to the cluster. The large cyan filled-circles with error bars are the locus of galaxies in the VIRMOS field (see text). The values of these four cyan circles were computed (from left to right) with 29 689, 35 804, 4788, and 511 galaxies. The large cyan open-triangles with error bars represent the galaxies in the VIRMOS field with mean surface brightness typical of the first pass WDCOs. The large cyan crosses without error bars are the galaxies in the VIRMOS field with mean surface brightnesses typical of the second pass WDCOs.
Current usage metrics show cumulative count of Article Views (full-text article views including HTML views, PDF and ePub downloads, according to the available data) and Abstracts Views on Vision4Press platform.
Data correspond to usage on the plateform after 2015. The current usage metrics is available 48-96 hours after online publication and is updated daily on week days.
Initial download of the metrics may take a while.