Fig. 7
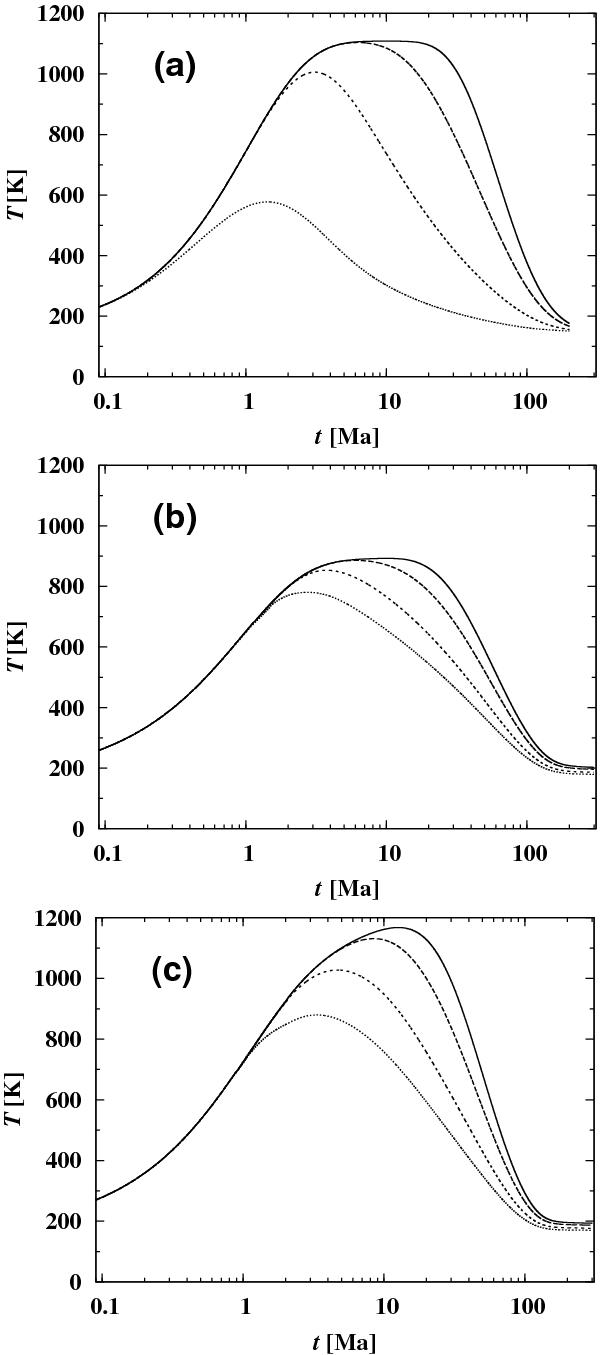
Temperature evolution of a body of 85 km radius at different depths from the surface and at centre: dotted line at depth 4.25 km, short dashed line at 17 km depth, long dashed line at 23 km depth. The full line shows the temperature evolution at the centre. a) The model is calculated with the same physical input as in the analytical model of Miyamoto et al. (1981). We provide the model parameters of MFT81 in Table 5. b) Similar model, but now calculated for a porous body, considering thermal conductivity of porous material according to Eq. (30), and sintering and cold pressing as described in this paper. We provide the model parameters of PL0 in Table 5. c) Same kind of model as b), but now additional heating by 60Fe and long-lived nuclei considered. We provide the model parameters of PL in Table 5.
Current usage metrics show cumulative count of Article Views (full-text article views including HTML views, PDF and ePub downloads, according to the available data) and Abstracts Views on Vision4Press platform.
Data correspond to usage on the plateform after 2015. The current usage metrics is available 48-96 hours after online publication and is updated daily on week days.
Initial download of the metrics may take a while.