Fig. 12
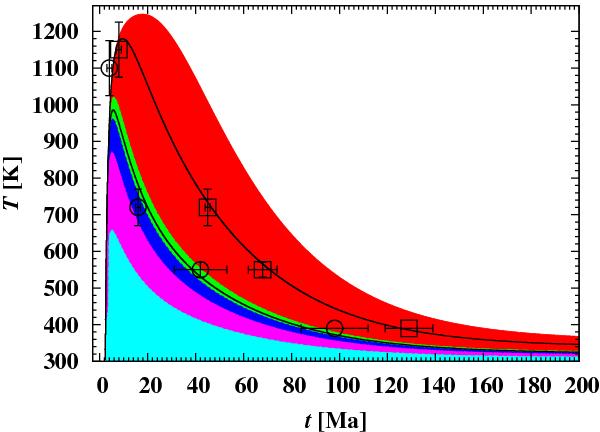
Optimum-fit model for the cooling history of the parent body of H chondrites. The abscissa is the time elapsed since the formation of the CAIs. We show the evolution of temperature at a number of depths below the surface. The upper contours of shaded areas correspond (from bottom to top) to depths of 0.32 km, 2.3 km, 7.8 km, 11 km, and the highest contour to the centre. The rectangular boxes and circles correspond to the empirical data for H6 and H5 chondrites, respectively, given in Table 6. Crosses are error bars. The dashed lines correspond to the temperature evolution at depths of 8.9 km (lower line) and 36 km (upper line) below the surface. They represent our best fit to the empirical data.
Current usage metrics show cumulative count of Article Views (full-text article views including HTML views, PDF and ePub downloads, according to the available data) and Abstracts Views on Vision4Press platform.
Data correspond to usage on the plateform after 2015. The current usage metrics is available 48-96 hours after online publication and is updated daily on week days.
Initial download of the metrics may take a while.