Fig. 9
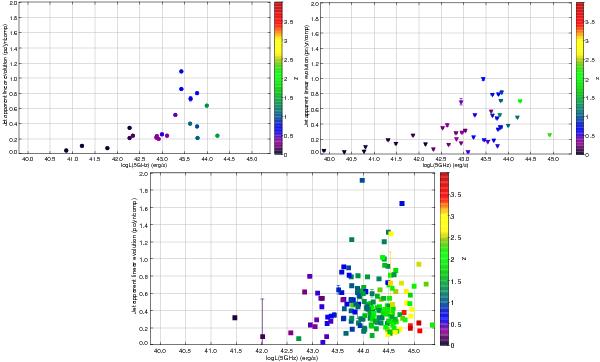
Total linear evolution of the jet ridge lines for the BL Lac and RG sub-samples (up; left and right, respectively) and the FSRQ sub-sample (down) as a function of the total source luminosity at 5 GHz. Quasars are shown with squares, BL Lacs with circles, and RGs with triangles. We use a color gradient to denote different redshifts.
Current usage metrics show cumulative count of Article Views (full-text article views including HTML views, PDF and ePub downloads, according to the available data) and Abstracts Views on Vision4Press platform.
Data correspond to usage on the plateform after 2015. The current usage metrics is available 48-96 hours after online publication and is updated daily on week days.
Initial download of the metrics may take a while.