Fig. 6
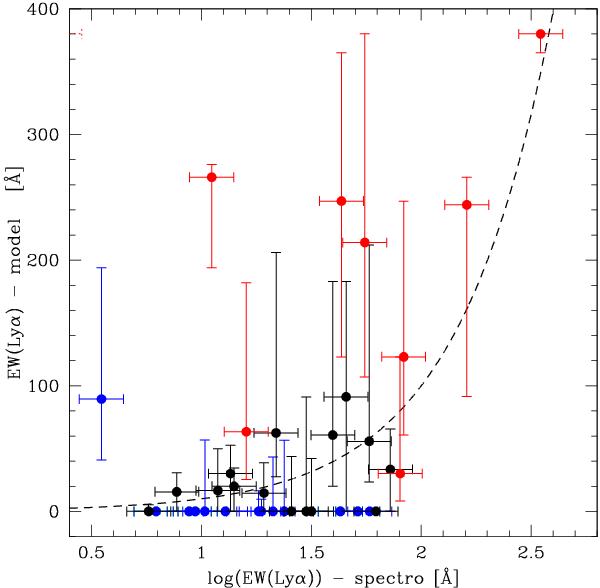
Comparison of the predicted Lyα (rest-frame) equivalent width with the observed one for the 36 objects in common with spectroscopic measurements of Stark et al. (2010). Observational errorbars of ~25%, typical for the brighter objects, are adopted. A logarithmic x-axis is chosen to optimise the readability of the plot. Red symbols indicate the i-drops, black V-drops, and blue B-drops.
Current usage metrics show cumulative count of Article Views (full-text article views including HTML views, PDF and ePub downloads, according to the available data) and Abstracts Views on Vision4Press platform.
Data correspond to usage on the plateform after 2015. The current usage metrics is available 48-96 hours after online publication and is updated daily on week days.
Initial download of the metrics may take a while.